One metric being watched closely the last 6 weeks is the progression in Q2 ’20 revenue expectations.
No surprise to readers Q2 ’20 expected revenue growth has been revised lower the last few months.
- SP 500 revenue grew 5.8% in Q4 ’19.
- SP 500 Q1 ’20 revenue as of 4/17/20 is expected to be flat y/y, as of 4/17/20
- SP 500 Q2 ’20 SP 500 revenue as of 4/17/20 is expected to down 6.7% which is the worst quarter for SP 500 revenue since Q3 ’15, when SP 500 revenue fell 4.3% y/y.
Here is how the Q2 ’20 SP 500 sectors rank today from expected strongest-to-weakest revenue growth:
- Health Care: +4.5%
- Utilities: +2.0%
- Staples: +0.8%
- Tech: +0.5%
- Comm Serv: -1.3%
- Real Estate: -2.8%
- Fincl’s -4.5%
- Materials: -8.2%
- Cons Disc: -11.4%
- Industrial’s: -19.7%
- Energy: -32.3%
- SP 500: -6.7%
Source: This Week in Earnings, IBES by Refinitiv, dated 4/17/20
Because Q2 ’20 is expected to be the bottom, these sector revenue growth rates are likely to represent “worst-case” growth or declines for 2020.
Just the last three weeks, here is the progression for Q2 ’20 expected revenue growth, again widely expected to be the low point for both SP 500 revenue and EPS growth:
- 4/17/20: -6.7% i.e 240 basis points of negative revision
- 4/10/20: -4.3% i.e 220 basis points points of negative revision
- 4/03/30: -2.1%
It’s no mystery that Energy and Industrial’s have been two of the hardest hit sectors (airlines are part of the Transport sector and the Transport sector was folded into Industrials early in the 2000’s).
Here is a ranking of the SP 500 sectors by their % of market cap within the SP 500 (as of 4/17/20 per IBES):
- Tech: +25.8%
- H/Care: +15.8%
- Comm Serv: +10.7%
- Financials: +10.3%
- Cons Disc: +10.3%
- Staples: +7.9%
- Industrials: +7.7%
- Utilities: +3.5%
- Real estate: +3%
- Energy: +2.6%
- Materials: +2.4%
- SP 500: 100%
The largest 5 sectors of the SP 500 comprise 62% of the index, while the bottom 5 sectors comprise roughly 18% of the SP 500 index, with the point being that Energy and Industrials as sectors don’t mean nearly as much as they did even 10 years ago, within the Sp 500.
Summary / conclusion: Q2 ’20 is widely expected to be the bottom of the Covid-19 pandemic crisis from an expected trough in the SP 500 revenue and EPS are concerned.
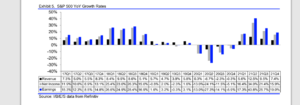
Note the y/y growth rates in the above table and how the chronology works.
What we want to watch is the Q3 and Q4 ’20 quarters and how they change as America gradually reopens and how the companies get innovative to reinvigorate growth.
Even though Q2 ’20 guidance will be lowballed and probably “worst-case” listen to see if CEO’s talk about the 3rd and 4th quarters and what is said about the rest of 2020.
The above graph and table have been pretty consistent i.e. the worst in terms of 2020 will be in Q2 in terms of SP 500 revenue and EPS growth.
Take all these comments with substantial skepticism. These projections and estimates will change daily and weekly.
Thanks for reading.