Is the secular bull market now over ?
My own opinion is “more no than yes”, even as SP 500 2020 EPS estimates are likely to get hammered over the next 30 – 45 days.
The answers to a question such as this is never binary, but a weighing of the probabilities.
Here is the long-term return chart of the SP 500 (total return) since 12/31/99:
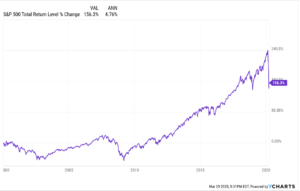
Note the “average annual return” (top of page) since 12/31/99.
This blog has showed this chart on previous occasions, including last September ’19, and August, 2018.
The “average, annual” return for the SP 500 over the long run is closer to 7% versus the 4+% shown in the chart above.
This market cycle, since 12/31/99, is still far short of that.
DataTrek addressed this issue on Wednesday March 25th, 2020, and the conclusion was interesting:
———————-
#3: At the other end of the investment horizon spectrum, let’s consider what the recent downdraft has done to long run (20-year) compounded annual returns for the S&P 500 and why that matters:
- Twenty years ago today, the S&P 500 sat at 1,140. With today’s close of 2475, that makes for a 20-year price CAGR of 4.0%. Add in dividend returns (1.8% average) and you get a 5.8% CAGR for the S&P 500.
- Even if you look at 20-year trailing returns from the February 19th 2020 peak, the numbers aren’t much better: a 4.9% 20-year price CAGR and a 6.7% total return CAGR.
- Bottom line: when the S&P was making new highs last month, long run returns were still low and now that we’re down +20% from those levels these 20-year CAGRs are even worse.
Think back to the late 1990s, when the S&P 500 had compounded at 18% annually for 20 years, and those 6-7% CAGRs for the last 2 decades look quite paltry by comparison. Yes, inflation has been lower, but that comes nowhere near to closing the gap. And one has to consider that the 6-7% CAGR from 2001 – 2020 has come with 3 sharp drawdowns (early 2000s, 2008, 2020) where the 1981 – 2000 experience was (excluding 2H 1987) much more placid.
Here’s why all that’s important:
Lower equity returns push capital into passive investments. Readers with long memories will recall that the late 1990s was the peak for active US equity management. There’s a good reason for that: you can pay an active manager 1-2% when presumed structural returns are 18% in the hopes of making 25-30%. When they are just 6-7%, every basis point of fees matters.
Lower structural public equity returns encourage institutional asset owners to reallocate capital to alternative investments like private equity and venture capital. Sovereign wealth/pension funds, family offices, and other managers have return targets they need to hit. Public equity returns of 6-7% don’t necessarily cover those, so they 1) index their stock exposure and 2) shift capital to potentially higher return non-public investments. Case in point: according to Crunchbase, from 2010 to 2019 total dollars invested in venture capital went from $48 billion to $295 billion annually.
When you combine lower structural equity returns with bouts of historically high stock market volatility and save-the-baby government policy interventions, investors (especially older individuals) are going to downshift their portfolio risk profile. We’ve seen this happen all through the 2010s, as US mutual/exchange traded money flows saw consistent outflows from stocks (despite a long rally) and into fixed income (despite ever lower yields). Given what has unfolded in recent days, we doubt that trend will reverse course regardless of where US stocks end the year.
————————-
If DataTrek’s three summary points are read, it makes a logical case for why the secular bull market in US stocks could be waning.
However (again) here is why I would think the secular bull might continue:
1.) The average annual return is still below average, even more so over the last 6 weeks, but it was below average even near the peak of the market in mid-February ’20;
2.) The secular bear market from March, 2000, through April, May, 2013 was a real secular bear market with two 50% declines in the SP 500 during that 13-year time frame;
3.) If we start measuring this secular bull market from the time we surpassed the old SP 500 high from October, 2007, the new bull market is just 6.5 years old.
Summary / conclusion: The one unstated conclusion from DataTrek’s analysis is that maybe passive investing has peaked. That will only be known in hindsight. As this is being written on Sunday night, the President is saying that social-distancing will be extended until April 30th, 2020, which likely means another stimulus program, and continued disruption of normal American life.
Again, this is just one opinion, but with social disruption occurring in the US as it is today, the “gloom-and-doom” crowd loves to call the end of the world and thus the end of the secular bull market is now over, and another one will start.
Would it really matter if – let’s say – the SP 500 ends 2020 with a total return of -5% ?
Why wasn’t the 4% drop in the SP 500 in 2018 called a bear market ? The SP 500 dropped over 20% from its late September ’18 peak to its December 26th, 2018 nadir.
Again, this is just one opinion but of the lows for the SP 500 are in for this “bear market” with a test of the December ’18 lows and the SP 500 treads water and makes a new all-time-high in the next 12 months, would the secular bull market really be over ?
Thanks for reading and remember to take all opinions regarding Wall Street issues and events with great skepticism. The capital markets change quickly.