In JPMorgan’s (JPM), “Guide to the Market” presentation last Monday, July 1 ’24, Dr. David Kelly, JPMorgan’s Chief Global Strategist, started off the call with the remark that, ultimately, “all systems break down”. David was quoting or paraphrasing one of the JPMorgan analysts, who had an engineering background by education, with the analyst using the word “entropy” in one of her missives. In physics, the word entropy’s 2nd level definition is “a gradual decline into disorder”, which we can loosely interpret as “all systems break down”.
Now, this is no way was a market call on Dr. Kelly’s part. Personally, I thought it was a good intro into a discussion about the economy and the markets today, both of which are seemingly in pretty good shape, but is a polite and disarming way to say that – in essence – all bull markets and good economies come to an end. (David Kelly is such a likeable guy and has a very unpretentious and disarmingly collegial personality, that I hope readers will understand that nothing written here will reflect on David’s opening remarks to the Guide to the Market webcast.)
SP 500 Annualized Returns:
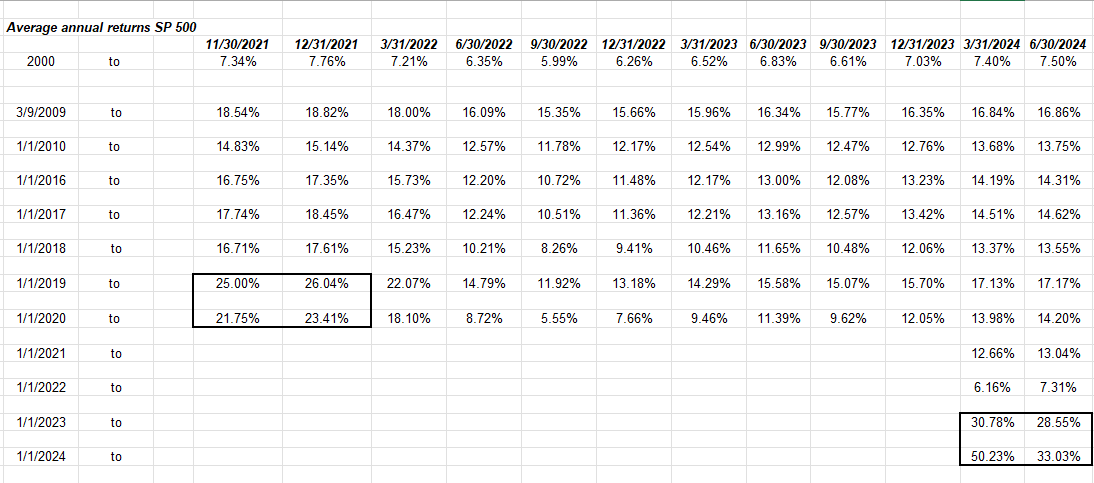
Return source: Ycharts software
After the decade of 2009, a considered effort was made by this blog to avoid similar mistakes to the late 1990’s and one aspect of the what some might call post mortem analysis, was to try and identify factors (other than the constant parade of overvaluation calls for the SP 500 and the Nasdaq between 1995 and March, 2000), that were in evidence, (and there were many on a daily and weekly basis), and the “annual return” or annualized return data for the SP 500 and the Nasdaq were definitely flashing red. The SP 500’s annual return alone for the period from 1995 to 1999 was 28% a year (think about that) and that doesn’t include the period from January 1 ‘2000 to mid-March 2000. The Nasdaq alone doubled from September ’99 to March 2000, a period of just 6 months.
The problem with the 1990’s was that stock market returns were “binary” (becoming similar to today): you were either largely a growth investor, and kept up with the SP 500, or – as an investment advisor or hedge-fund manager – you were largely value, and underperformed dramatically for 5 1/2 years. Value investing back then ( and value was defined as below 1x price-to-book, under 10x PE, etc.) was largely commodity stock investing, and small-cap driven as – just like today – small-cap, equal-weight, value, and international remain completely out-of-favor. The other aspect to this not always well understood is that in every bull market there is a ” generational difference” around investing. My first analyst job at a mutual fund firm was from 1992 to 1995, and the first day I started, I saw a terminal device on my desk, (it looked like a small TV) after I had been working with PC’s and spreadsheet software for several years already. Because this firm had been in existence since the late 1940’s and had managed money for many iconic American families, the older portfolio managers (both the stand-alone guys who were more similar to brokers and the mutual fund managers), seemed very leery of the personal computer and technology in general. (The research department was quickly given PC’s and spreadsheet software.) Many wanted to stay with the device tied to the mainframe, despite the fact that IBM was blowing up and dropping from it’s high of $175 pre-October, 1987, crash to the early 90’s $50 share price.
A lot of older investors (man and women, as women were starting to manage mutual funds at that time) were just leery of tech in the 1990’s. Now, 25 – 30 years later, I’m that person, not in discipline, but I’m that “old guy” who is looking at AI and LLM’s (large language models) and thinking, “maybe I’ll play this through the ETF’s rather than individual stocks”.
A Red Flag:
Getting back to the “annual return” table at the top of the page, note the black-bordered area in the lower right-hand corner. Just like the black-bordered area in the middle-left of the table which occurred in late 2021 (which prompted these articles from this blog, here, here and here), the lower right hand corner shows recent annualized returns for the SP 500, which are not sustainable.
The 18-month annualized return for the SP 500 is 28.55%. That’s a tad stretched.
If nothing else, investors could (and should) expect a good flush, a correction greater than April, ’24’s -4.08% drop in the SP 500, and the Nasdaq Composite’s and Nasdaq 100 total returns of -4.48% and -4.63% respectively.
Top 10 Holdings: occasionally this blog details clients top 10 positions when aggregating all client assets as one portfolio, since so much of this blog’s writings are for stocks that aren’t covered daily in the mainstream financial media. Here’s clients Top 10 holdings as of June 30 ’24 and the YTD return for the holding:
- JP Morgan Income Fund: +3.31%
- Microsoft: +19.26%
- JPMorgan: +20.12%
- Oakmark Int’l: -4.17%
- Amazon: +27.29%
- Nasdaq 100 (QQQ): +17.34%
- Charles Schwab: +7.83%
- Alphabet (GOOGL): +30.54%
- NetFlix: +38.61%
- SPY: +15.23%
- Merck: +14.97%
- Emerging Mkt ETF EMXC (ex-China): +7.76%
This distribution is distorted by 1 – 2 large 100% equity accounts. The majority of the accounts and assets are managed on a “balanced” basis, using some derivation of the traditional 60% / 40% standard portfolio benchmark target.
- The SP 500 (total return) returned 15.29% in the first half of ’24;
- The 60% / 40% standard balance portfolio returned 8.78% in the first half of 2024;
- Russell 2000 (IWM): +1.62% YTD return
Summary / conclusion: On Friday morning, July 5th, investors will get the June nonfarm payroll report at 7:30 am central, and given how weak the ISM – Services report was on Wednesday, July 3rd, ’24, the Treasury market rallied sharply in response to the surprisingly weak data. Services are roughly 85% of GDP in today’s economy, so services data matters.
This blog post was written on June 8 ’24, drawing similarities between today’s SP 500 and the late 1990’s.
The big difference between today and 24 years ago is sentiment: stock market sentiment today is borderline “fearful” but seems almost apathetic. The peak in 2021 was lead by bitcoin and SPAC’s. It’s been two and half years since we’ve heard about SPAC’s, but bitcoin still gets some press, but is hardly the frenzy that it was in 2021. This is important since sentiment can drive markets higher (and lower) than might otherwise be found at normal valuations.
Ed Yardeni, one of the Wall Street greats, throws a wet blanket on some of the AI hype this weekend with this article released on LinkedIn on July 2nd, 2024. Ed raises a good point about the semiconductor cycle i.e. it’s still a cycle, and also questions some of Jensen Huang’s and Sam Altman’s prognostications. (In my words, the hyperbole is really flowing…)
Tom Lee, in my opinion one of the best market prognosticators in the last 5 – 10 years, came out this past week, and said he thought the SP 500 could get to 15,000 or triple by the year 2030. That is pretty ambitious. If it wasn’t Tom Lee, the forecast probably wouldn’t have gotten the media attention it did.
Just an average correction of 10% – 15% for the SP 500 would go a long way to restore the “wall of worry” to investing. The SP 500 could use a good flush.
None of this is advice or a recommendation, but only an opinion, which should be taken with considerable skepticism. Past performance is no guarantee of future results. Investing can involve the loss of principal even for short periods of time. All return data courtesy of Ycharts.
Thanks for reading.