In an email to clients this week, the first major difference between the late 1990’s and today’s stock market (and by that, is meant the SP 500, and Nasdaq Composite), is sentiment.
Today’s sentiment is almost apathetic compared to the frenzy of the late 1990’s. In September, 1999, using a monthly chart of the Nasdaq Composite, the Comp closed at 2,750 on September 23 ’99, and then rose a cumulative 86% by March 23, 2000, hitting 5,132.52, in just 6 short months. (Think about that, and this was after the 5 years beginning in January 1 ’95.)
The SP 500 had a 28.5% annualized return between 1995 – 1999, and a cumulative return of 251%, while the SP 500’s annual return between January 1, 2020, and May 31 ’24 is 13.56%, and a cumulative return of 70%. (Return data sources from Ycharts.com)
If you didn’t live through the late 1990’s and managing money for clients, it’s truly hard to comprehend what that was like.
Today, here are some similarities:
Weaker breadth:
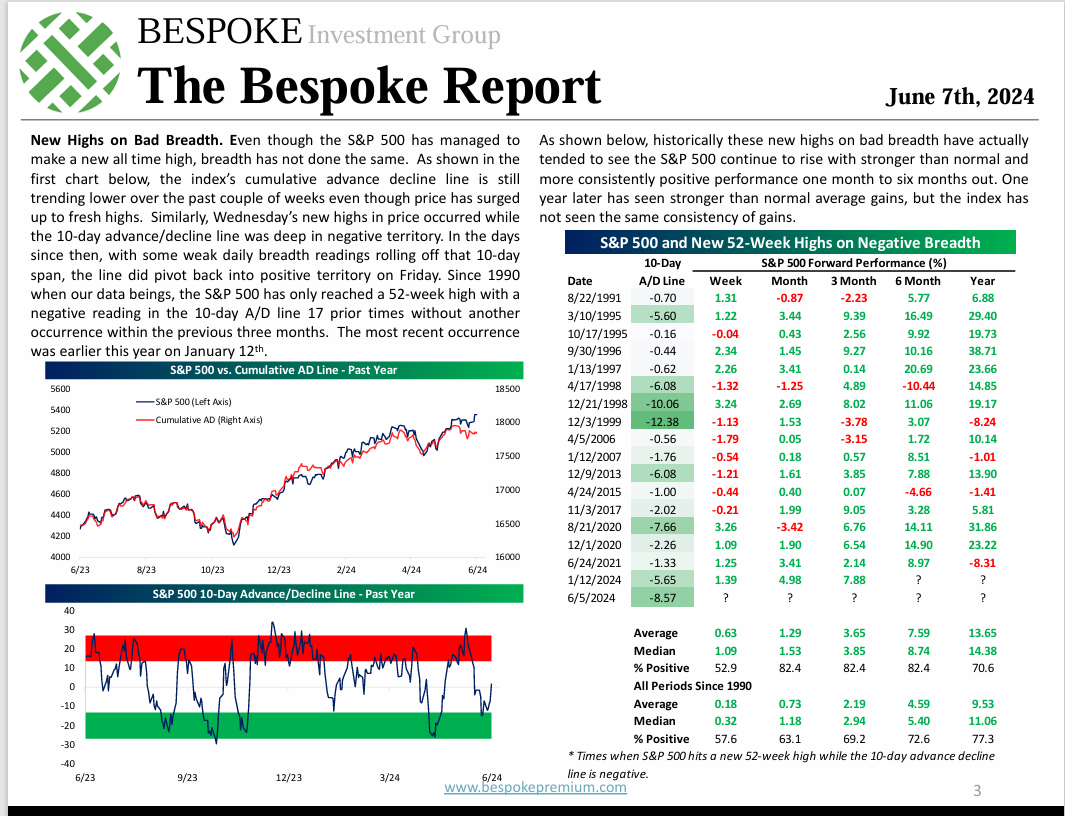
This is page 3 of the Bespoke Report this weekend. The “weak breadth” conundrum lasted almost five full years in the late 1990’s accompanied by the similar narrow leadership within the SP 500 at that time as well.
The interesting aspect to breadth is that – if you look at the right hand table of the above p. 3 of the Bespoke Report – the “average” forward returns are respectable, particularly over the next year. (Be sure and enlarge and read the commentary as well.)
This blog follows breadth pretty closely, and it has become weaker the last few months.
Narrow market leadership:
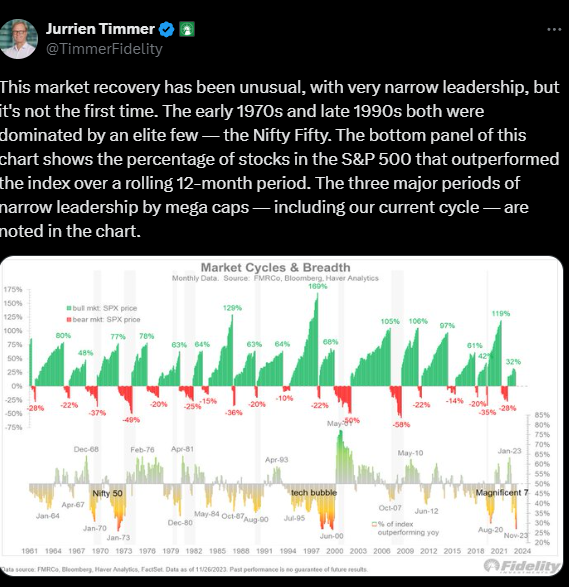
This chart – from Jurien Timmer of Fidelity from late 2023 – demonstrates the narrow market leadership that the SP 500 is becoming famous for (again), just like in the late 1990’s. Readers can see the 1973 – 1974 Nifty 50 bear market, and then the late 1990’s “tech bubble” and then late 2021 and now today.
Just writing this what struck me was that the time lapse between the 1973 – 1974 Nifty 50 bear market, and the SP 500 and Nasdaq tops in March, 2000, was roughly 25 years. In March, 2025, it will be 25 years between the tech and growth stock top and today’s market.
The 2008 bear market – which was also a 50% correction but driven by housing and the financial system – might mitigate that to some extent.
Since the bottom in March, 2009, at 667 on the SP 500, it’s been about 15 years since we’ve seen a similar correction.
The Federal Reserve:
Alan Greenspan was running the Fed in the late 1990’s and he was raising rates from June, 1999 to May, 2000, (here) and many thought that was the primary reason for the growth stock bubble breaking, but – like any dramatic event – there were other reasons too. Even though the Fed has stopped raising the fed funds rate as of July ’23, tightening monetary policy obviously resulted in the sharp correction in the SP 500 (-18% return) and the Nasdaq Composite (-32% return) in calendar 2022.
The Fed still matters when considering wholesale rebalancing in terms of market leadership.
Finally, underperforming asset classes:
The Russell 2000, SP 500 equal-weight (RSP) and international returns all underperformed dramatically relative to the SP 500 and the Nasdaq in the late 1990’s. (Technically, the RSP didn’t come public until May of 2003, which eliminated what would have been a substantial period of outperformance for equal-weight ETF’s as the Nasdaq and the top 10 names in the SP 500 started to come apart quickly after March, 2000.)
Using the Russell 2000 as one example, let’s compare annual returns vs the SP 500 since January 1, 2000:
January 1, 1995, to December 31, 1999:
- SP 500: +28.5%
- Russell 2000: +16.57%
Jan 1, 2000, to May 31, ’24:
- SP 500: +10.7%
- Russell 2000: +8.9%
Jan 1, 2010, to May 31 ’24:
- SP 500: +13.55%
- Russell 2000: +10.13%
Jan 1, 2015 to May 31 ’24:
- SP 500: +12.56%
- Russell 2000: +7.37%
Jan 1, 2020 to May 31 ’24:
- SP 500: +13.56%
- Russell 2000: +6.41%
Jan 1, 2023 to May 31 ’24:
- SP 500: +27.11%
- Russell 2000: +13.75%
It’s the ratio that intrigues me. Running the numbers, it was surprising to see the Russell 2000 return half the SP 500’s return in the late 1990’s. That 16.5% return is still a decent return for the last half of the 1990’s decade.
Readers can see as we moved through last decade 2010 to 2019 and now into this decade, the return gap between the Russell 2000 and the SP 500 is definitely widening, and reaching the same ratio again.
Summary / conclusion: A major consideration in writing “perspective” articles like this is that it forces me to recall major market events, what might have precipitated them, and how similar or different are we today, versus history.
Originally I thought that – given the two 50% bear markets we saw between 2000 and 2009 – it would be unlikely that investors would or could see another 50% bear market so soon. (The 2000 to 2002 bear market for the Nasdaq was 80%.)
The SP 500’s total return as of Friday, June 7, 2024, was 12.7% and a 60% / 40% balanced portfolio had returned 7.15%. Given that it’s an election year, and traditional stock market election year cycle returns are usually pretty decent, (and SP 500 earnings are holding up quite well), don’t overthink it too much.
What has kept me bullish is the fact that the SP 500 didn’t overtake it’s March, 2000, high of 1,550 to 1,575 until May 2013, and the Nasdaq 100 and the Nasdaq Composite didn’t also overtake their March, 2000, highs until 2017.
However, it’s likely that the Russell 2000 (IWM), the SP 500 equal-weight (RSP) and international positions will see their weights lifted in client accounts as we move forward.
A lot depends on the Presidential election too.
It makes sense to turn more cautious on “expected forward returns”.
None of this is advice or a recommendation, but only an opinion. Past performance is no guarantee of future results. All return data above is sourced from Ycharts, while all SP 500 EPS and revenue data is sourced from LSEG. Investing can involve losing money even for short periods of time. Readers should gauge their own comfort with portfolio and stock market volatility and adjust their own accounts accordingly.
Thanks for reading.