Trying to write an entire blog post without mentioning the “c-word” is tough these days but watching full-year “expected” SP 500 2020 sector growth rates is the one way (in my opinion) to gauge on a week-to-week basis how the Street is incorporating coronavirus information into earnings estimates.
Here’s how expected 2020 SP 500 sector growth rates have changed since January 1 ’20:
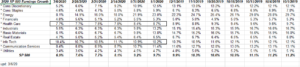
A few comments on the trends:
1.) The overall decline in the expected 2020 SP 500 earnings growth rate since January 1 through March 6, 2020, is just under 300 bp’s. For comparison purposes, i took a look at the deterioration in the expected, full-year 2019 SP 500 earnings growth rate from January 1 ’19 through March 1 ’19 and it was 330 a bp decline. Despite the c-virus worries, last year’s rate of deterioration was worse than 2020 (so far).
2.) Technology estimates for 2020 have really held in well. Watching Fast Money tonight (as I do on Friday nights, writing this earnings post), the FM crowd seemed bearish on tech, particularly Apple at tonight’s close of 2089. (Given the warnings by Apple and other SP 500 large-cap components, and the fact that the expected growth rate for Tech for 2020 hasn’t yet deteriorated, makes me more optimistic than that crowd. Many of the large-cap Tech names are now approaching their 200-day moving averages.
3.) As you might expect Health Care deterioration is just 100 bp’s since January 1 ’20. Both Tech and Health Care have higher expected growth rates than the overall SP 500 for 2020 so “relatively” speaking, both sectors are expecting better growth as of March 6, 2020.
4.) The Financial sector has started to see the first significant revisions lower this week, after the expected growth rate was seeing higher revisions all year. The remarkable drop in the 10-year Treasury yield has to be crushing spread lenders like regional banks (KRE). JP Morgan has traded down from $141 on January 2nd, 2020, to $108 as of tonight’s close. Goldman Sachs is now trading below book value, which is $218 per share.
SP 500 Earnings data (by the numbers):
- Fwd 4-qtr est: $174.30 vs last week’s $175.39
-

click to open / enlarge - The rate of change for the forward estimate is slowing since late January ’20 as you’d expect, but still well above the Nov 1 ’19 low. Part of the reason that the rate of change may be holding up is the rapidly slowing comp’s from 2099 at this time.
- PE ratio: 17x
- SP 500 earnings yield: 5.86% vs last week’s 5.93%
Summary / conclusion: Last year at this time (March of 2019) the expected SP 500 growth rate for 2019 has already slowed from 7% to 4% by the first week of March and ultimately dropped to 1% growth for the year, where it is today as the last three weeks of SP 500 earnings for 2019 finish up.
The most surprising stat for me this week is that this year’s expected annual deterioration is a bit better than 2019’s pace of deterioration despite the C-virus fears.
Starbucks had the most stunning data late this week as SBUX management noted that SBUX comp’s in China were down 78% and will be down 50% for all of SBUX’s fiscal Q2 ’20 (ended March ’20). SBUX noted their US retail business “remains strong for now”.
The SP 500 didn’t make new lows this week. That was very important.
More to come over the weekend.
Thanks for reading.
(Please note all opinions on this blog are my own, and readers are encouraged to take all opinions with a grain of salt. Markets change quickly for reasons we only know in hindsight. Evaluate all opinions and market information in light of your own financial profile.)