One odd fact no one has yet mentioned is how – for the 2nd month in a row – the SP 500 had a very rough last week of the month, taking a gain to a loss.
It seems like ancient history with the coronavirus captivation, but the last week of January ’20 saw the SP 500 drop 1.26% which seems trivial after this week’s 11.5% decline, but then February 3rd the rally reignited up till the last week of the month.
The SP 500’s total return for January ’20 was -0.04%, thus triggering the “as January goes, so goes the market” meme.
In last night’s post we showed readers the revisions for the sectors for Q1 ’20, which – given the headlines – you’d expect to see.
However let’s look at the rest of 2020:
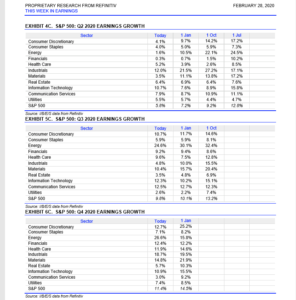
The reason i prefer IBES by Refinitv data is that it tracks the chronology of sector growth rates over several times periods, rather than Factset’s two data points in time.
Here is a couple of quick thoughts on above so readers aren’t punished by grinding over the data:
- Q2 ’20 will likely look a lot like Q1 ’20 in that sharper revisions will likely start in April not a small part as a function of the expected contraction in China’s GDP in the next 6 months;
- Both surprisingly and somewhat puzzling, look at the trend in overall SP 500 earnings growth for Q3 ’20. It’s not seeing the negative revisions (yet)
- Something is keeping Energy growth elevated in Q4 ’20, which would be a significant change in the pattern to the Energy sector;
- The Financial sector’s earnings growth remains quite stable, even as the stocks in the sector get their teeth kicked in. Note how for Q4 ’20 the Financial sector is actually seeing an upward revision to expected growth – somewhat unusual 7 months out. That is a positive, but let’s see if it holds up.
- So far anyway, the 3rd and 4th quarter of 2020 SP 500 earnings growth expectations are holding up, but that could / will change as move through the year. Remember, we always look for positive (upward) revisions to expected sector growth rates, which is a more statistically reliable tell than negative (downward) revisions over time.
Summary / conclusion: Given the typical number of deaths each year IN the US from just the ordinary winter flu (20,000 ?), the worries over the coronavirus seem quite bizarre, but given the way information is disseminated in the media, it isn’t surprising. The SP 500 has seen three 20% corrections since the secular bull market beginning in March ’09, and the 2015 – 2016 correction, didn’t even get to 20%, and probably closer to 14%.
The “average” SP 500 correction each year is 13% per JP Morgan’s work.
No predictions will be made for readers as to what the market will do here next week or over the next few months, but the improving odds of another fed funds rate cut might keep a floor under any correction.
The latest estimate seen of China GDP was that it was expected to contract 6% next quarter. That’s a sharp drop for the world’s 2nd largest economy.
You would think as long as the US consumer stays healthy, the US could weather any decent contraction in US GDP growth based on the C-virus.
The close on Friday was a big positive in my opinion and February ’20 non-farm payrolls get reported next week, with the Briefing,com consensus expecting 170,000 in net new jobs added to the US economy and the Briefing.com forecast calling for 185,000 net new jobs added.
A lot of retailers report this week, i.e. Target, Costco, etc. and while US consumer demand probably will not see a C-Virus impact, it will be interesting to hear what is said from a supply-chain perspective.
Thanks for reading.
Take any opinion found in this blog as just that – an opinion – and please make your own decisions based on your own financial profile. As we learned this week, financial conditions change quickly.