This weekend, the numbers and metrics will be updated for readers, but today, I wanted to show readers how 2020 sector estimates have changed during October ’19.
Some management start to give a first pass on how next year will look with the 3rd quarter financial results and in addition some sell-side analysts start to build assumptions in for next year, based on 3rd quarter results with Apple being a perfect example. Stronger iPhone demand relative to supply has lifted fiscal 2020 estimates (Apple’s fiscal year begins October 1).
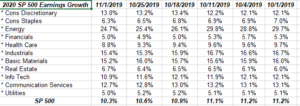
So what’s does this table tell readers ?
As this log’s readers have been told for years, the natural progression of forward estimates is to see downward revisions until the quarter arrives and then a spike higher is typically seen, as this chart shows for Q3 ’19:
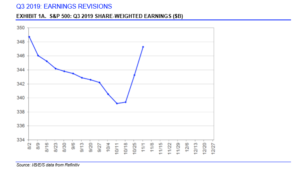
This is the pattern of the 3rd quarter, 2019 SP 500 earnings estimate, as graphed from a calendar or time perspective. You can see the steadily downward revisions until the 10th day of the new quarter (October 10th, 2019) and then the sharp spike higher as SP 500 components started to report their results.
If you think this is unusual or I’m making this up, here is Quarter 1 and Quarter 2, 2019’s SP 500 earnings estimates:
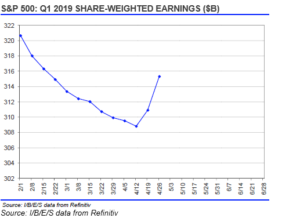
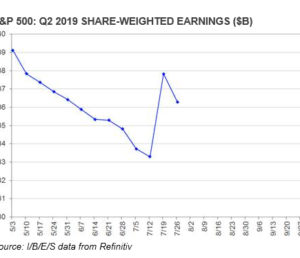
This is called the ‘fish-hook” by Jeff Miller (www.dashofinsight.com) and Ed Yardeni, and most other SP 500 earnings followers as it details the normal pattern of slow erosion into the earnings period and then the sharp revisions higher after we see the normal “upside surprise” from both EPS and revenue from SP 500 companies.
Readers can see how the downward pattern prevails until the 10th day or so of the new quarter.
But back to Q3 ’19 results. The top spreadsheet has two sectors that are bucking the normal downward trends at least thus far in calendar Q4 ’19:
- Consumer Discretionary
- Real Estate
Consumer Discretionary is housing and autos and in terns of individual stocks, it’s Amazon, McDonald’s, Home Depot, Starbucks, etc.
Those subsectors and stocks have performed well in 2019, and AT LEAST THUS FAR, analysts are taking numbers up for the consumer discretionary sector for 2020, versus the normal downward revisions.
None of this means this will hold for the next 15 months, but with the decent US job growth reported this morning, and three fed funds rate cuts in the last 3 months, nothing has changed so far for 2020 in terms of being concerned about the US consumer.
It’s an early tell that has worked well for me in the past (and thus has worked well for clients) and it is telling investors that worries about the consumer in 2020 might be exaggerated.
Personally, I was hoping to see Industrials show better revisions. Energy is continuing to see negative revisions and fairly sharp ones, although Exxon’s and Chevron’s results from this morning won’t show up until next week’s data.
Summary / conclusion: This blog will be out with the hard data tomorrow and some of the valuation metrics for the SP 500, but “expected” 2020 EPS growth per the top spreadsheet is still looking for 10% – 11% growth.
Exactly one year ago at this time, in early November ’18, the “expected” SP 500 earnings growth for 2019 was 9%, and had fallen to just 7% by the end of December, 2018. The point being that things can change quickly in terms of the estimates and the math.
Check back tomorrow for more metrics.
Thanks for reading.