It was the 4th quarter of 2018, where the growth rate started to slow for the SP 500, although we really didn’t get a sense of that until Q4 ’18 earnings reports started in January, 2019.
In 2020, the compares start to get easier with the beginning of Q4 ’19 earnings.
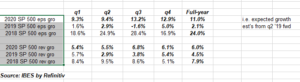
The above spreadsheet shows three years of SP 500 EPS and revenue data, most importantly the surge in EPS last year with passage of the Tax Cuts & Jobs Act (TCJA).
While SP 500 revenue growth hasn’t varied much, readers can also see the Q2 ’19 revenue growth of +2.9% is the lowest since Q3 ’16 (not shown).
Summary / conclusion: This kind of blog post is more a “bigger picture” perspective on SP 500 earnings, in that no sector analysis or conclusions are being drawn for readers, other than the tough quarterly compares for 2019, will start to fade with the start of Q4 ’19 when the Q4 ’18 EPS growth started to fade sharply from the first 3 quarters of 2018.
Per Factset, SP 500 “organic” EPS growth for 2018 was closer to 14% rather than 22% – 24% actual growth, after the TCJA impacts were eliminated.
One final thought for 2020: the 11% – 12% expected SP 500 EPS growth rate next year has changed little in the last 37 weeks.
Thanks for reading.