(This blog’s RSS feed is going away – please resubscribe to this blog at www.fundamentalis.com (no charge) if you wish to continue to receive market commentary.)
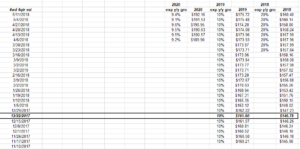
Readers can see the dramatic ramp in 2018 SP 500 earnings by week, from the date President Trump signed the tax bill on December 22, 2017.
5 weeks prior to signing the tax bill, the 2018 SP 500 earnings estimate had increased just over $1 over that span. The next 5 weeks following the singing of the tax reform bill, the 2018 estimate jumped a little less than $7 per share.
But we know all this.
2019 and 2020 SP 500 EPS estimates look to return to a more normal 9% – 10% growth rate.
SP 500 earnings data “by the numbers”:
Fwd 4-qtr est: $163.16 vs last week’s $163.10
PE ratio: 16.7x
PEG ratio: 0.80x
SP 500 earnings yield: 5.98% vs last week’s 6.12%
Year-over-year gro of fwd est: +20.9% vs +20.76% last week
(Source: Forward estimate from T/R IBES’s This Week in Earnings, the rest of the data is internal)
Commentary: The 2018 EPS estimate is now firmly above $160 and the forward estimate above $163. While the SP 500 earnings growth rate is topping, the absolute levels of SP 500 earnings growth, are not peaking. What is eventual peak earnings for the SP 500 for this cycle ?
Hard to say.
Our long-term data on SP 500 earnings have the early 1980’s annual EPS at $16.66 for 1985, peaking near $50 in 1999 – 2000. SP 500 earnings bottomed in 2008 at $65 per share, so proportionally speaking, one wild guess for this cycle would put the ultimate, peak, SP 500 earnings print near $200 per share.
This is loose math to say the least. Take it with a huge grain of salt, and it ultimately depends on how long the business cycle lasts.
Jeff Miller over at www.DashofInsight,com and I used to discuss what the expected 2018 SP 500 EPS estimate would be pre tax reform and we thought $150 – $155 would be a big number. Here is a blog update from last fall – just as tax reform legislation was getting serious – estimating 2018 numbers based on tax reform. My 2018 estimate was way light at the time.
Thomson Reuters weekly data “by the numbers”:
Fwd 4-qtr est: $163.16 vs $163.10 from last week
SP 500 PE ratio: 16.7x
SP 500 PEG ratio: 0.80x
SP 500 earnings yield: This week’s 5.98% vs last week’s 6.12%
Year-over-year growth of fwd est: +20.9% vs last week’s +20.76%
(Source: Thomson provides “forward 4-qtr estimate”, the rest of the data is this blog’s work)
There is little that is not known about the positive SP 500 earnings story in 2018 – even SP 500 revenue growth is gradually improving.
This is a positive, fundamental underpinning to the US stock market, but stock prices will likely peak 8 – 12 months before we see the change in actual SP 500 earnings estimates.
Always keep that in mind.
Thanks for reading.