If you are not a Bespoke subscriber you should be since – for a very reasonable price – you get to read great research every week. (And Paul Hickey never gives discounts – to me anyway- for plugging his product.) The weekly Bespoke Report published every Friday is one of the best “summary” pieces I read each week, and with the Twitter and the blogosphere, there is a lot of quality research now available at very low cost.
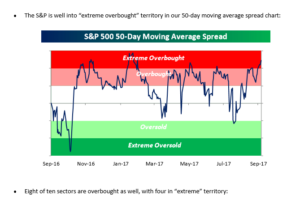
The thing is in past periods of an “overbought” market, the SP 500 just moved sideways for a while working off the overbought nature and never really “correcting”.
Even as overbought as the SP 500 is today, it is still “relatively” lower than January ’17 and all the excitement and anticipation over the Trump “pro-business” agenda.
Q3 ’17 SP 500 earnings:
Overall Q3 ’17, SP 500 earnings growth is “expected” to come in at roughly +5%.
Looking at the Thomson Reuters data, Financial sector estimates were revised lower sharply this week, probably due to Hurricane Harvey and Irma-related losses.
Here was the change in Q3 ’17 estimates in just the last week:
- Cons Disc: +0.5% vs +0.5% as of 10/1
- Cons Spls: +3.5% vs +2.7% as of 10/1
- Energy: +136%, vs +134% as of 10/1 (still lapping easy comp’s from last year)
- Fincl’s: -6.2% vs +0.6% as of 10/1
- Hlth Care: +3.7% vs +3.7% as of 10/1
- Industrials: +5.1% vs +5.2% as of 10/1
- Basic Mat: +4.3% vs -0.4% as of 10/1
- Real estate: +3.3% vs +3.2% as of 10/1
- Technology: +12.2% vs +12.2% as of 10/1
- Telco: -1.3% vs -1.3% as of 10/1
- Utilities: -2.3% vs. -2.3% as of 10/1
Source: Thomson Reuters I/B/E/S “This Week in Earnings” dated 10/6/17
Analysis: Note the sharp downward revisions to Financial’s this week, but also note the sharp upward revision to Basic Materials, and Consumer Staples. it is somewhat unusual to see sharply higher revisions to numbers “pre-earnings” unless the Street has gotten specific guidance.
The bigger issue though – thinking of “price” relative to earnings – is that most of the SP 500 remains “overbought” relative to historical levels:
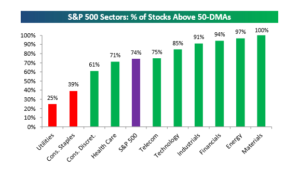
Consumer Staples – particularly with the weaker dollar this year – looks to be the best relative sector value – given the combination of earnings trends and trading patterns.
Thomson Reuters data (by the numbers):
- Fwd 4-qtr estimate: $141.87
- P.E ratio: 18(x)
- PEG ratio: 1.89(x)
- SP 500 Earnings Yield: 5.56%
- Year-over-year growth of fwd estimate: +9.52% after last week’s first print over 10% in years
Analysis /conclusion: Note the bump in the forward estimate over $141 per share this week, that is a record again and each quarter the “roll” or “bump” into the next quarter should continue to see records as SP 500 earnings growth remains healthy.
Q4 ’17 earnings and revenue growth look particularly strong – that will be discussed tomorrow on the blog.
There is a lot of different issues that get discussed each week in the financial media: tax reform, North Korea, the never-ending political discussions that are the functional equivalent of grade-school, spit-ball fights, but SP 500 earnings provide a longer-term frame of reference that should help readers and investors stay anchored when turbulence occurs.
One last point: Carl Quintanilla, the talented and poised CNBC anchor who sits with Jim Cramer every weekday morning feeding Jim softballs for the CNBC morning viewing audience, noted in a tweet this week that
“At this rate, there really WILL be some young, fund managers who’ve never known a down year.” (This is Carl’s tweet posted 10/2/17.)
The point of this is not to pick on Carl, but I noted in a response that in the 1982 – 2000 secular bull market, the SP 500 had just one down year, and that was 1990, thanks to Saddam Hussein invading Kuwait.
Here is the 1980’s and 1990’s secular bull market in the SP 500. The SP 500 annual return is the 4th column.
Year
| 1999 – actual | $50.82 | 15% | 21.04% |
| 1998 – actual | $44.07 | 1% | 28.58% |
| 1997 – actual | $43.50 | 6% | 33.36% |
| 1996 – actual | $41.02 | 6% | 22.96% |
| 1995 – actual | $38.74 | 42% | 37.58% |
| 1994 – actual | $27.32 | 19% | 1.32% |
| 1993 – actual | $22.95 | 12% | 10.08% |
| 1992 – actual | $20.56 | -12% | 7.62% |
| 1991 – actual | $23.47 | -3% | 30.47% |
| 1990 – actual | $24.22 | -6% | -3.10% |
| 1989 – actual | $25.83 | 46% | 31.69% |
| 1988 – actual | $17.75 | 15% | 16.61% |
| 1987 – actual | $15.47 | -5% | 5.25% |
| 1986 – actual | $16.28 | -2% | 18.67% |
| 1985 – actual | $16.66 | 31.73% | |
| 1984 | 6.27% | ||
| 1983 | 22.56% | ||
| 1982 | 21.55% |
Source: SP 500 annual return data per Morningstar’s SBBI (Stocks, Bonds, Bills & Inflation). SP 500 annual earnings data compliments of Thomson Reuters I/B/E/S