Caterpillar reported their Q1 ’13 earnings this morning, missing on both EPS and revenues, and then guiding lower for 2013, lowering EPS guidance to “about $7.00” from the current consensus of $7.70, and the stock finishes higher on the day on heavy volume. CAT has seen numerous analyst downgrades pre the earnings release, and I suspect all the bad news is now in the stock price.
I think the stock is a far better value today than when it was trading up above $100, since the cash-flow valuation has improved greatly.
CAT will likely take some time to bottom in here. We took our first position in the stock this morning in some time, and plan on adding more if CAT should trade down to $78.
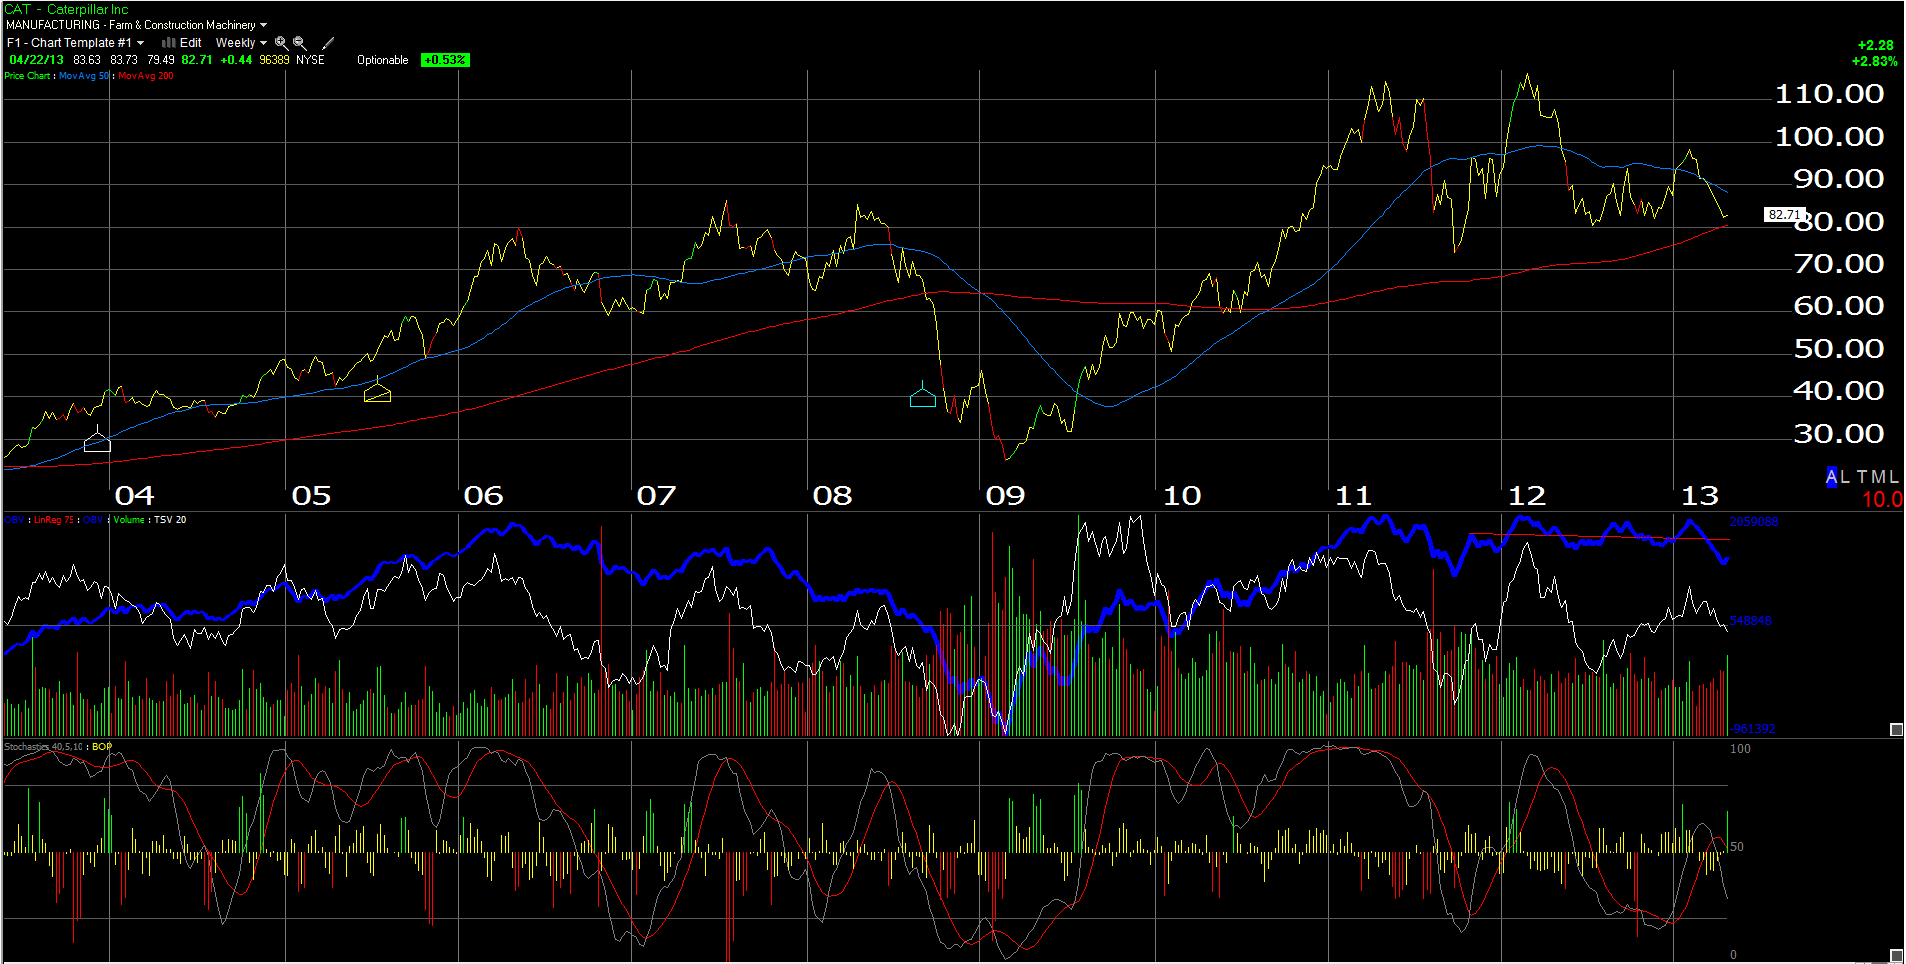
Technically, the above weekly chart,which is longer-term in nature, shows CAT nearing good support at the 200-week moving average, which is $80 per share.
A trade below $78 on heavy volume and we would be out of the position.
CAT is a long cycle business, and their mining business is under pressure, more so after the collapse of gold, silver and copper in the last few weeks. However I think all the bad news is being discounted in the stock.
CAT needs a return to strong global growth to push it to all-time highs, and back above $115 – $116, the highs from 2011 and 2012.
Trinity Asset Management, Inc. by:
Brian Gilmartin, CFA
Portfolio manager
312-810-3480