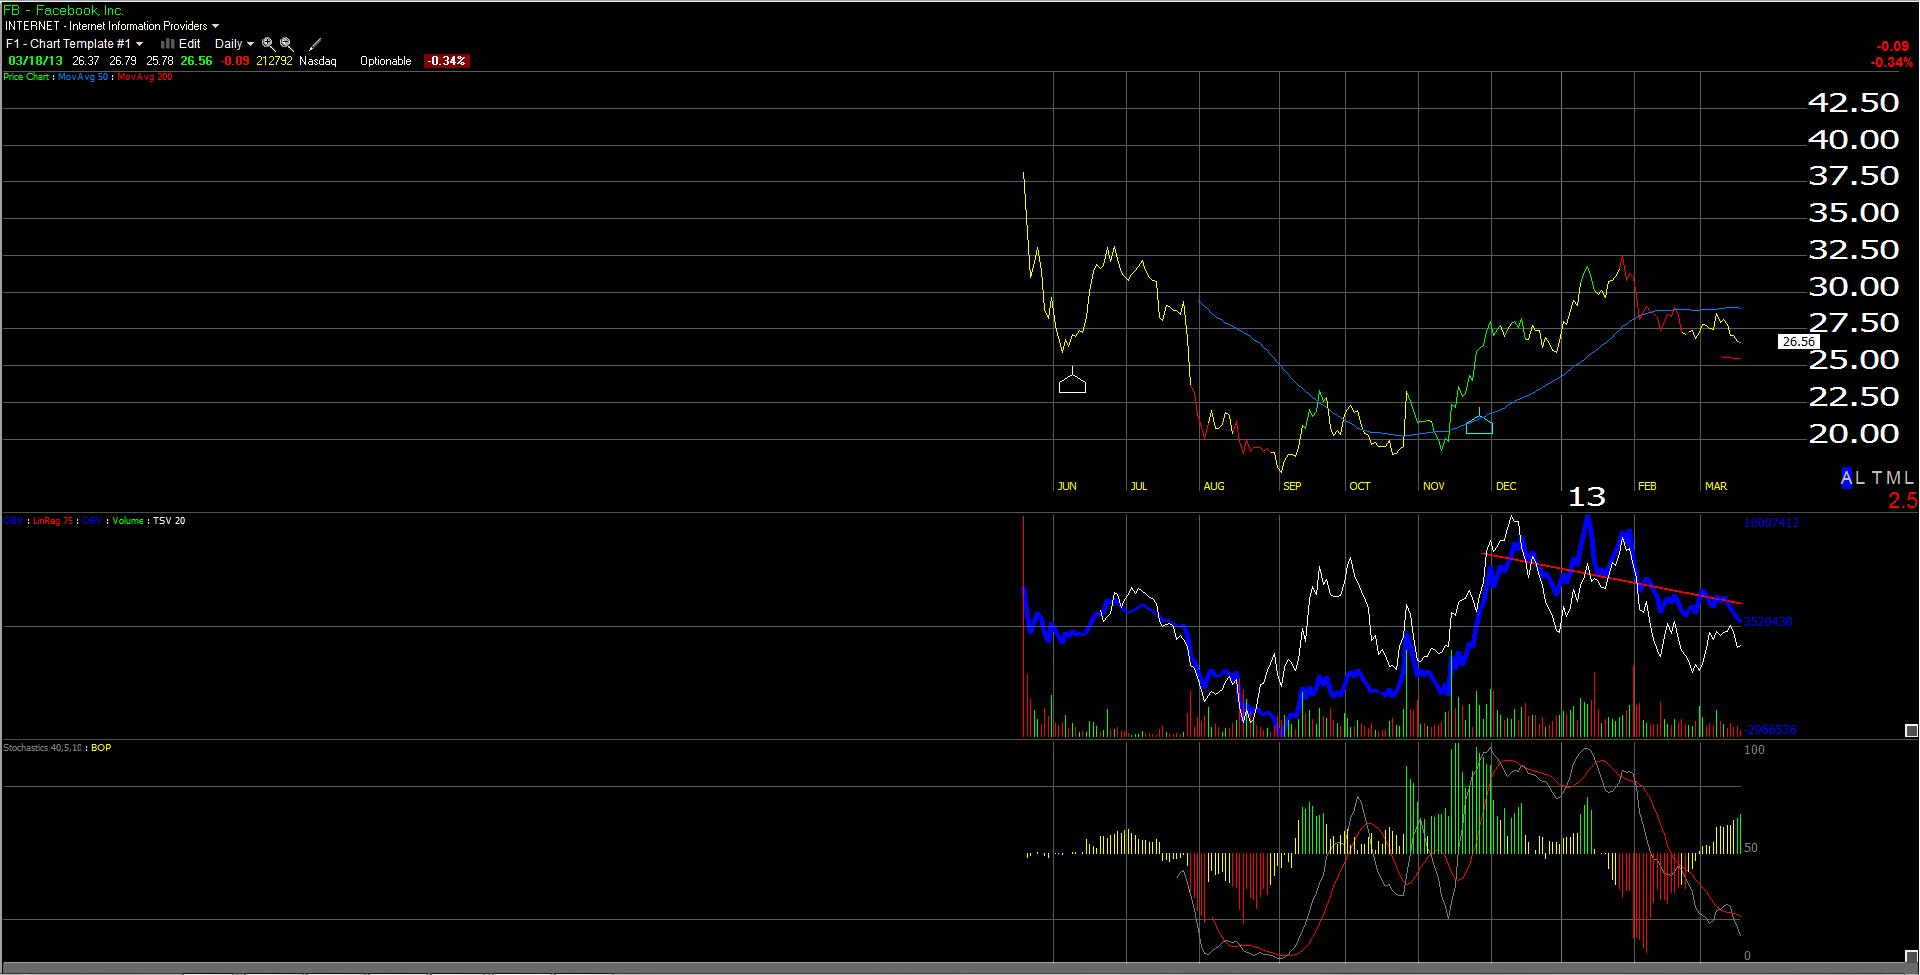
The chart is a couple of days old, but FB finished the week of March 22nd at $25.73, down 3.5% on the week, and about to touch its 200-day moving average. The excellent technician Gary Morrow, a long-time friend and Street.com contributor, thinks $25.05 is the technical price point at which you should add to FB. We never try and be that precise, and would add to current positions below $25.50.
We’ve been nibbling at the stock since around $28 per share, and it is now pretty oversold.
Fundamentally, FB is in the same place as Amazon (AMZN) in that while revenue estimate revisions are positive, earnings estimates revisions for 2013 and 2014 are negative thanks to rising spending and SGA expenses at FB.
Still, I think this is an early-stage growth company, and is THE social stock to own of the mobile, social, and cloud trilogy occurring within growth tech these days.
Estimated EPS growth in 2013 and 2014 is expected at 8% and 39% while revenue growth for the same years is expected at 31% and 27%.
Facebook is stepping on the spending while they can, similar to Amazon, and crushing EPS as they do it.
While the 2014 p.e ratio of 39(x) might seem salty, according to ThomsonReuters, “operating cash-flow per share” (OCFPS) for FB is expected at $1.25 in 2014 which leaves FB trading at a much-more reasonable 20(x) expected OCFPS for 2014.
Be patient, in the next few weeks you should be able to buy a quality growth stock at a low-risk buy point. (Dont forget to hit “Like”.)
Trinity Asset Management, Inc. by:
Brian Gilmartin, CFA
Portfolio manager
312-810-3480