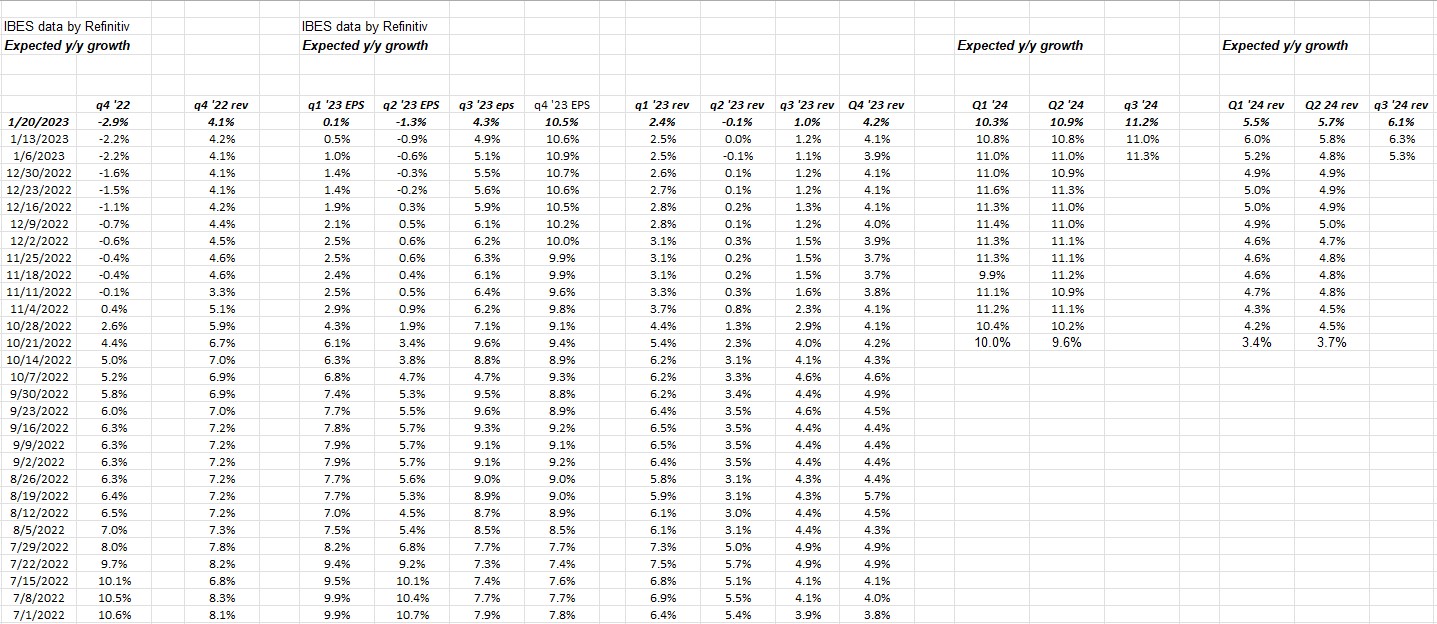
Looking at this table, which is constructed from IBES data by Refinitiv’s Earnings Scorecard, indicates that the Q4 ’22 and the first 6 months of 2023 are likely to see earnings weakness, within the SP 500.
However – as this blog has noted in the last 7 weeks – Q4 ’23 and the 2024 data to the right of the 2023 expected revenue growth rates is showing that later in ’23 the dynamic starts to change and – at least as of this week – SP 500 earnings weakness is expected to reverse.
That’s one perspective and opinion: maybe the bigger question is, “How much of ’23’s expected SP 500 earnings weakness is discounted into current prices ?”
SP 500 earnings data:
- The forward 4-quarter earnings estimate slid again last week to $226.23 from the previous week’s $227.67 and Sept 30th’s $230.
- The PE ratio on the forward estimate is 17.6x this week versus the Sept 30th 15.5x multiple;
- The SP 500 earnings yield as of this week was 5.70% versus the recent peak of 5.86%.
- The Q4 ’22 bottom-up EPS estimate for the SP 500 came in at $53.27 versus last week’s $53.50 and the 9/30/22 value of $57.30.
Rate-of-change: 12-week revision still improving (becoming less worse):
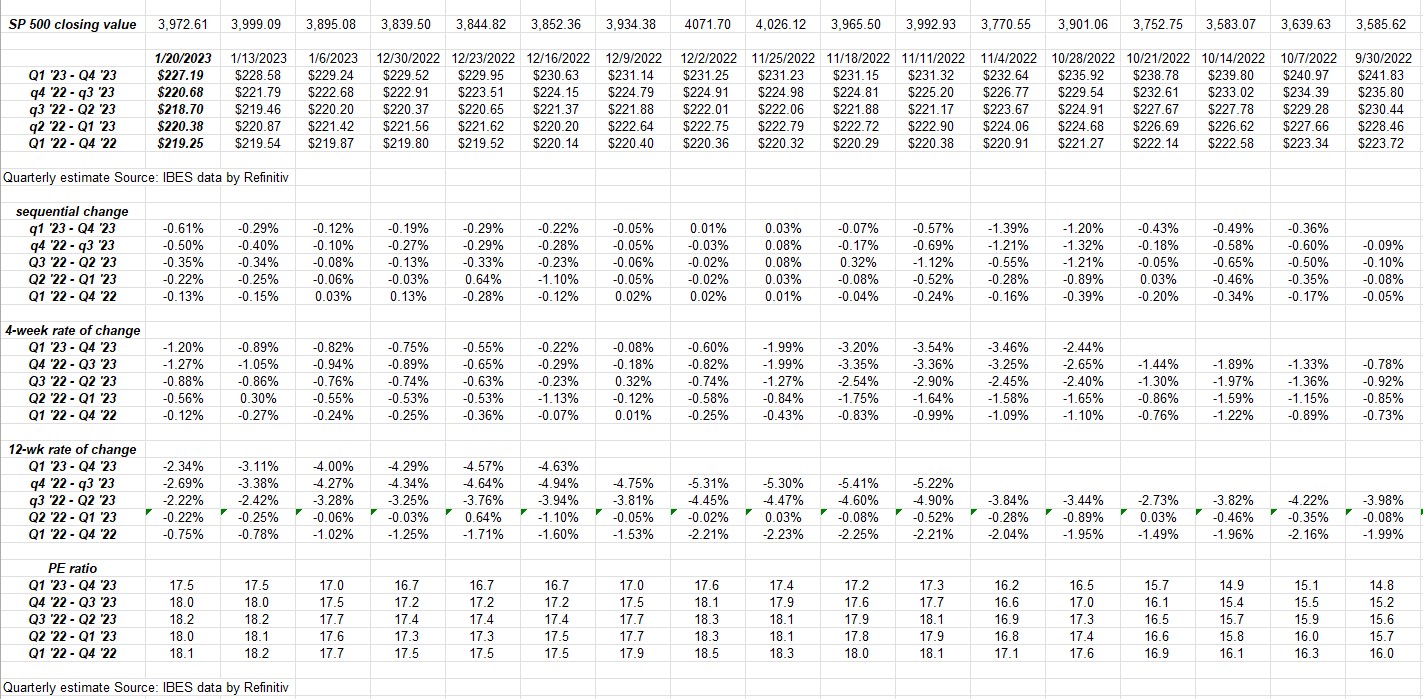
Looking at the bottom 3 sets of rows in the attached table, the sequential and 4-week rates of change worsened this week, but the 12-week rate-of-change in the forward SP 500 EPS curve are still improving. The actual forward EPS estimates for the SP 500 are found in the first set of rows at the top of the spreadsheet.
Since IBES data by Refinitiv do not provide quarterly 2024 EPS estimates for the SP 500 until late March, early April ’23, we can only look so far out in terms of the actual dollar estimate, although the expected growth rates, found at the top of today’s blog, and tracking expected growth rates, gives us some clue as to what the trend in the actual dollar estimates will look like, once they are published.
Looking at the 12-week revision data this week, it feels a little like Bill Murray in CaddyShack i.e. “At least we got that going for us”.
Summary / conclusion:
If readers are wondering about individual stock analysis and valuation methodology in terms of what managing client money and the kind of analysis done weekly on this blog, the methodology and process are exactly the same. This week, the forward EPS and revenue estimates were updated the big banks and financials that reported on January 13th, 2023 and then early this week, specifically, JP Morgan (JPM), Bank of America, (BAC), Citigroup (C), and Charles Schwab (SCHW) forward EPS and revenue estimates were updated on the valuation spreadsheets and updated in the models.
Bank of America’s forward EPS estimates (2023 through 2025) continued to be revised lower (from the Sept ’22 and June ’22 estimates), while JP Morgan and Schwab reflected 2023 EPS estimates that were “meh”, while 2024 and 2025 EPS estimates were revised higher. Citigroup was revised lower too, like Bank of America, with the big difference being analysts could be incorporating divested (or soon to be divested) operations in those forward estimates, even though capital strength and ROE could improve with the divestitures. (Technically, which Doug Busch over at @Chartsmarter pointed out in one of his weekend notes, C looks better technically and according to Doug, could be poised for a run to $60, with a 4% dividend yield to boot.) Citigroup remains the cheapest of the big banks in terms of price-to-tangible book value at a 38% discount to that metric.)
Microsoft (MSFT) and Tesla (TSLA) report this coming week and then the following week, investors hear from Alphabet (GOOG/GOOGL), Meta Platforms (META), Apple (AAPL), and Amazon (AMZN).
What readers don’t realize is that the mega-cap or top 10 names in the SP 500 with the largest market-cap weights, also carry some of the largest “earnings weights” in the SP 500 as well. Tesla is one exception, but when the “market-cap weight” and “earnings weight” get distorted i.e. too far apart, like what happened in late 1999 and early 2000, the ensuing “rotation” can get ugly. My own opinion is that this isn’t anything like 2000 to 2002 in terms of mega-cap names, but we’ve also seen a slight shuffling already in the top 10 names in the SP 500.
Personally, we could see 2023 be a “blah” year for the top-heavy SP 500 and the mega-cap names do nothing, while small and mid-cap (SMID) and international and Non-US really start to outperform. 2023 has started that way already, but it’s early in the year. Certainly the weakening dollar is helping international and non-US asset classes.
Given how the data is unfolding, few sell-side analysts are sticking their neck out and seem willing to boost estimates prior to companies reporting and issuing guidance. One thing learned from Covid in 2020 and 2021, is that when the macro changes, the standard deviation of individual EPS and revenue estimates can be quite high, i.e. analysts will – at least during Covid in 2021 – greatly underestimate results. The “upside surprises” that we saw in 2021 in the SP 500 EPS and revenue results have diminished greatly in 2022 and we could see downside surprises in early 2023, although the bank and financial results could have been prime subjects for that to happen in Q4 ’22 and the revisions weren’t too bad.
Past performance is no guarantee of future results and this is simply one individual’s opinion. Take it all with a healthy grain of salt and considered skepticism. This blog is written in order to instill the discipline to remain current on SP 500 EPS data, and encourage the thought process around portfolio allocation and sector / stock selection. At various times, this could all look very good or very bad. Capital markets can change quickly both positively and negatively, based on events that cannot be predicted.
Thanks for reading.