First, let’s take a look at the last five years of annual SP 500 EPS and the year-over-year (y/y)growth rate :
- 2019: $162.93 for +1% y/y growth
- 2018: $161.93 for +23% y/y growth (tax-reform aided)
- 2017: $132.00 for +12% y/y growth
- 2016: $118.10 for 1% y/y growth
- 2015: $117.46 for -1% y/y growth
The current 2020 SP 500 EPS estimate (as of IBES by Refinitiv’s, Friday May 1,2020’s This Week in Earnings) is $130.90 for an “expected” y/y decline of -20%.
Some smart prognosticators, and I believe one was Ed Yardeni, thought the 2020 estimate would wind up somewhere between $115 – $135, or a midpoint of $125 and we look to be headed there.
What’s remarkable is that the “average” SP 500 EPS growth rate for the above 5 years is 7%, the exact average for SP 500 earnings growth post WW II.
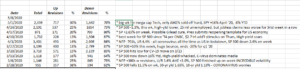
Here is the sequential basis point change in the “forward 4-quarter” SP 500 EPS estimate:

Note the sequential improvement in the decline of the forward 4-quarter estimate this week, which we can take with a grain of salt since it’s the first week of such improvement, but it’s there nonetheless.
Readers should like to see that, but it must continue.
Remember this “forward 4-quarter estimate” includes the period from Q2 ’20 through Q1 ’21.
Here are the expected calendar year SP 500 EPS estimates for 2020 through 2022 as of this weekend:
- 2022: $189.63 for expected +13% y/y growth
- 2021: $168.04 for expected +28% y/y growth
- 2020: $130.90 for expected-20% y/y growth
The average for SP 500 earnings growth for the calendar years 2020 – 2021, continues to be +4% as was shown last week.
SP 500 EPS estimate revisions have shown improvement:
Each week IBES by Refinitiv publishes SP 500 estimate changes (i.e. revisions) which are tracked on our own spreadsheet.
We have been seeing positive revisions grow steadily as a percentage of the total revisions since late March, early April ’20:
Again, readers should be skeptical, but given the speed of the US lockdown and the unknown duration of sheltering-in-place, we can probably assume that once analysts incorporated what was known into their models, the revenue and estimate revisions were likely quite harsh, as 2nd quarter, 2020 estimates indicate.
As you might expect in typical bull markets, the positive revisions don’t usually fall below 50% during an earnings period.
There is still a long way to go to get back to 50% revisions, but the “green shoots” are emerging.
What does the “SP 500 forward earnings curve” look like ?
- Q1 ’21 – Q4 ’21: $168.04
- Q4 ’20 – Q3 ’21: $158.42
- Q3 ’20 – Q2 ’21: $148.48
- Q2 ’20 – Q1 ’21: $134.78
- Q1 20 – Q4 ’20: $130.90
These forward estimates will gradually come down, but it gives readers a look at the expected change in forward SP 500 estimates.
Readers need to be shown some history on this to make it more meaningful.
Quick update on 2020 SP 500 revenue and EPS growth expected by quarter:
- Q4 ’20: -10.4% EPS growth (no revenue growth estimate provided)
- Q3 ’20: -21.0% EPS growth (no revenue growth estimate provided)
- Q2 ’20: -37.8% EPS growth on -10.6% revenue growth
- Q1 ’20: -12.7% EPS growth on +0.2% revenue growth
Source: IBES by Refinitiv This Week in Earnings
The data have shown for the duration of the Covid-19 pandemic that Q2 ’20 would be the bottom for SP 500 y/y EPS and revenue growth, and right now I have no reason to think that won’t be case.
The gradual reopening in the US that has already started in rural areas and smaller areas of the US is a start, but given population density is a major factor in the severity of the pandemic, you’d have to think that the major population centers of the US will open much more slowly.
Summary / conclusion: The early signs of sequential improvement of the rate of decline in the forward SP 500 EPS could be transitory and even evaporate quite quickly so take the optimism with some degree of skepticism. These are estimates updated every day and week, and the estimates could change greatly over the next few weeks and months.
Some readers are skeptical of Q2 ’20 being the bottom for SP 500 revenue and EPS estimates (in aggregate) but that has what the data has shown the last 6 – 8 weeks.
As long as the “expected” 2021 SP 500 estimate stays above the $160 – $163 level and thus doesn’t drop below the final 2019 estimate of $162.93, I suspect that pullbacks for the SP 500 could be quite short and the bias to the SP 500 benchmark could be higher.
The best sign this week was the reception of Boeing’s expected $25 bl bond deal as it continues to indicate the corporate credit markets are open, functioning smoothly and open for business.
The other metric that is worth watching is the expected Q2 and Q3 ’20 quarterly SP 500 EPS growth rates.
I wouldn’t want to see Q3 ’20 estimated SP 500 EPS and revenue growth rates drop below Q2 ’20.
Thanks for reading.
Remember, when dealing with forward SP 500 EPS and revenue data, all of the data is “estimated” by sell-side analysts and the change / updates to this data is continuous, which is why “trend-spotting” is so important.
Take all opinions regarding the stock market today with skepticism. There is so much we don’t know yet about current events.