In this weekend’s SP 500 earnings update, it was mentioned that first quarter’s of the year can see negative EPS estimate revisions. I thought readers should be shown some of the historical data tracked on “SP 500 EPS estimate revisions” over the years. You must excuse the general geekiness of this data, but as my oldest sister said to me when I showed up late for a family party and I told her i had to update some Excel spreadsheets on SP 500 earnings data, “Ok, now i know why you are still single.”
The middle two columns are the number of estimates revised upward and percentage of those changed positively, and the last two columns are the number of estimates revised negatively and the percentage of negative revisions.
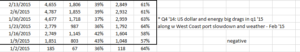
First quarter, 2014:
![]()
Note how the “negative revisions” exceed 50% for the quarter. This is when Russia invaded Ukraine, and Venezuela devalued the bolivar. This was actually Q4 ’13 earnings being reported and in 2013, the SP 500 rose roughly 35% so bullishness was high coming into the new year. These revisions are not just the SP 500 either – according to the IBES by Refinitiv footnotes they represent “estimate revisions all (publicly-traded” US companies.”
The SP 500 rose 1.8% in Q1 ’14. At one point in mid-February the SP 500 was down 5%, mainly on Ukraine.
First quarter, 2015:
The big event in late 2014 was the collapse of crude oil and the dramatic strengthening of the US dollar from September ’14 through March ’15. In fact that 6-month period saw one of the sharpest increases in the US dollar ever for that period of time. EPS estimates revisions that were positive just barely got above 40%.
The SP 500 rose 0.95% in Q1 ’15.
First quarter, 2016:
![]()
Everyone remembers Q1 ’16 – high yields credit spreads widened substantially, crude oil bottomed at $28 per barrel, and the SP 500 fell 6% the first week of the year. For not one week of the busy earnings season did positive EPS revisions get above 40%. The SP 500 bottomed in Q1 ’16 and went on its historic run.
For the first quarter of 2016, the SP 500 finished up about 1% after being down 10% in mid-February ’16.
First quarter, 2017:
![]()
Remember, the first quarter of 2017 was the first full quarter of President Trump’s presidency and the first full quarter of the republican House and Senate. It was also the quarter where just SP 500 “EPS revisions” were tracked and even with the above, only one week – January 20th, 2017 saw revisions greater than 50%.
What’s even more interesting is that the total return for the SP 500 in Q1 ’17 was 6%.
First quarter, 2018:
![]()
This first quarter of 2018 was the peak of the post Q1 ’16 rally where January was strong until the VIX spiked sharply in late January ’18. The revisions were sharply positive all quarter after 2017’s 22% calendar year return on the SP 500. The SP 500 fell 5% the first week of February ’18.
First quarter, 2019:
![]()
Even the first calendar quarter of 2019, just a year ago, the “positive” revisions were all below 50% for the key reporting weeks.
That could have been a function of the Q4 ’18 correction in the SP 500 of 13% which was just getting started in terms of the 2019 rally.
Summary / conclusion: Four of the last 6 first quarters to start the year have seen a preponderance of negative EPS revisions as Q4 earnings were reported and guidance given for the coming year, with most week’s below 50%. Is company guidance driving this ? Is analyst caution after 2008 keeping expectations subdued ? Is it just coincidence that most of the bad news seems to come with 4th quarter earnings releases and guidance for the coming calendar year ?
The above data should probably be compared with subsequent quarters of those years, but i suspect without even eyeballing the data, since the only negative year for the SP 500 being 2018 in the last decade, in other years the “positive / negative” revision ratio probably improved as analysts saw that the year was turning out better than what was originally indicated.
My own opinion on the general bearishness of analysts regarding forward prospects is that it’s partly a hangover from 2008, the worst recession in the post WW II era, but also management’s have little incentive to be aggressive, which is the complete opposite of the late 1990’s.
That’s just an opinion.
Curious as to what readers think of the data. (Don’t be harsh.)
Thanks for reading.
My personal email is brianglm@trinityasset.com