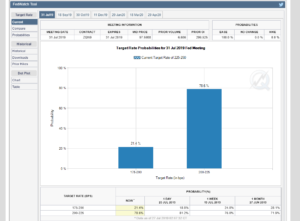
So much will be written this weekend about the FOMC meeting Wednesday, but here is the snapshot of the CME fed funds future contract probabilities as of Friday, July 26th, 2019.
Sure looks like we get a 25 bp reduction Wednesday, July 31, at 1:00 pm.
The money markets have already discounted a 50 basis point move: here is where key Treasury yields closed Friday, July 26th, 2019:
- 3-mo: 2.12%
- 6-mo: 2.10%
- 1-yr: 2.00%
- 2-yr: 1.86%
The 2-year Treasury isn’t a money market instrument but readers can see the inversion in the short end of the curve.
Take this with a grain of salt but i wouldn’t be surprised to see some selling in the short end of the curve after Wednesday night.
SP 500 Earnings data (by the numbers):
- Fwd 4-qtr est: $173.88 vs last week’s $174.34
- PE ratio: 17.4x
- PEG ratio: 2.66x
- SP 500 earnings yield: 5.75% vs last week’s 5.86%
- Year-over-yr growth of fwd est: +2.96% vs last week’s 3.53%
Summary / conclusion: the last data point within the above bullet points is what worries me: the forward 4-quarter growth rate (basically the forward expected growth rate for Q3 ’19 through Q2 ’20) has fallen below 3%. The expected growth rate using the bottom up numbers by analysts is still looking for 12% growth next calendar year 2020, so something will have to give shortly as we roll into 2020 and the gap between the “through Q2 ’20” number of 2.96% is reconciled with the “calendar 2020” expected growth rate currently of 12%.
Without getting too mind-numbingly boring, basically the SP 500 earnings growth rate for the first half of 2019 is flat or near flat while revenue growth is low single digits.
Will the FOMC change that this week ? Hard to say.
The earnings releases this week led to some negative revisions for Q3 ’19 and the rest of ’19.
Looking back at 2015 and early 2016, the “expected forward 4-qtr growth rate” was negative through most of 2016’s first half and really didnt start to ramp higher until Q4 of 2016. Again though, that’s one period of recent history. But revenue growth in Q4 ’15 and early, 2016 was actually negative for the SP 500, while the first half of 2019 is still positive albeit low single digit y/y growth.
About 200 of the SP 500 have reported Q2 ’19 results. We still have roughly 60% of the benchmark left to report.
Thanks for reading. More out tomorrow.