The SP 500 weekly data:
- The forward 4-quarter estimate (FFQE) fell this week to $220.49 from last week’s $221.34, and 12/31/22’s value of $222.91;
- The PE ratio as of 3/31’s market close is 18.6x versus 17.9x as of last Friday’s close and 12/31/22’s 17.2x;
- The SP 500 earnings yield fell to 5.37% this week, but it should increase with the “quarterly bump” next week in the FFQE;
- Interesting that the Q4 ’22 bottom-up quarterly EPS estimate for the SP 500 ended tonight at $53.16, not very different from the 12/31/22 estimate of $53.87. Given some of the dire forecasts, that Q4 ’22 bottom-up quarterly estimate could have been well under $50;
Refinitiv hasn’t released the quarterly bottom-up EPS estimate for 2024 yet – all we have is the calendar year estimate of $247.57 – but sometime before April 7th, we should see the quarterly estimates appear, and by next weekend the “forward 4-quarter estimate” should be back in the range between $225 – $227, versus today’s $220.49.
This may be confusing to readers, but with tomorrow being April 1st, 2023, the “forward estimate” will now consist of the sum of Q2 ’23 quarterly EPS through Q1 ’24.
And we don’t yet have that data.
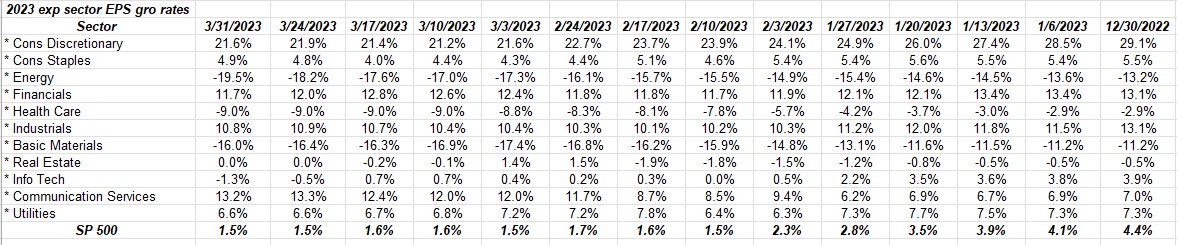
This Refinitiv table shows the progression of sector growth rate estimates since 12/31/22 for calendar-year 2023.
The only sector to see an increase in the expected full-year 2023 EPS growth (so far in 2023) is Communication Services. That’s probably due to META and it’s significant headcount reductions, cost cuts and share buyback.
Q1 ’23 expected EPS growth:
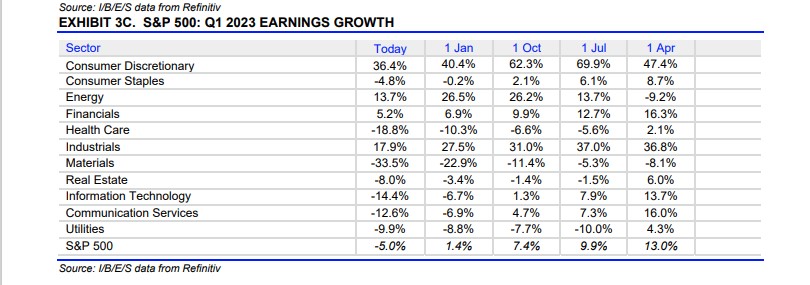
Ironically the sector that looks down the least is financials. Energy’s expected EPS growth has been cut in half.
Technology doesn’t look good either.
Q1 ’23 expected sector EPS growth ranked strongest to weakest:
- Consumer Disc: +36.4% (think Tesla and Amazon, homebuilders, etc.) Consumer Disc EPS fell 27% in q1 ’22, most likely due to Amazon.
- Industrials: +17.9% vs +40% growth in q1 ’22, tough compare.
- Energy: +13.7% vs +269% growth in Q1 ’22.
- Financials: +5.2% vs -17% decline in Q1 ’22) JP Morgan, Goldman, etc. had very tough capital market and investment banking compares in q1 ’22;
- Cons Staples: -4.8% vs +8% in Q1 ’22;
- Real Estate: -8% vs +25% in Q1 ’22;
- Utilities: -9.9% vs +24.6% in Q1 ’22
- Communication Serv: -12.6% vs -2.8% in Q1 ’22. Mostly META and Alphabet (GOOGL);
- Tech -14.4% vs +14.6% in q1 ’22, but software was already weakening in late Q4 ’21.
- HealthCare: -18.8% vs +18.3% in Q1 ’22;
- Basic Materials: -33.5% vs +46.3% in Q1 ’22.
- SP 500: -5% vs +11.4% in Q1 ’22.
Seven of the 11 sectors are expected to have negative EPS growth in Q1 ’23, probably due to tough comp’s in Q1 ’22. The total market cap weight of the 4 sectors expecting positive EPS growth is 35% – 36%. Energy is still just a 4.5% market cap weight in the SP 500. Financials is 13% market cap weight.
Q1 ’23 expected revenue growth by sector ranked strongest to weakest:
- Financials +9.1% (bet that’s a surprise to readers) vs +2.2% in Q1 ’22;
- Consumer Disc: +6.4% vs +9.9% growth in Q1 ’22;
- Industrials: +5.6% vs +12.6% in Q1 ’22;
- Real Estate: +4.9% vs a +20.8% compare in Q1 ’22;
- Cons Spls: +3.8% vs. +9.5% in Q1 ’22;
- Utilities: +3% vs +2.4% in Q1 ’22;
- Health Care: +7% vs +14.7% in Q1 ’22;
- Comm Services: -2.2% vs 0% in Q1 ’22;
- Technology: -4.4% vs +12.4% in Q1 ’22;
- Energy: -5.8% vs +59.5% in Q1 ’22 (very tough compare)
- Basic Materials: -8.3% vs +23.8% in Q1 ’22;
- SP 500 +1.6% rev growth expected vs 14% in Q1 ’22;
Basic Materials is close to the bottom of the list in both EPS and revenue rankings. Technology doesn’t look great either. There is a big disconnect between Q1 ’23 technology performance and price action and sector consensus expectations for Q1 ’23 of -14.4% EPS growth and -4.4% revenue growth.
Industrials had a very good year in 2022, and again the EPS and revenue growth looks stronger, relatively speaking.
Summary / conclusion: The goal is to get an earnings-related post out every day until next Friday, April 7th, so there is much to discuss. Q1 ’23 earnings should start the next week, probably closer to April 13th or 14th.
The market’s strong start to 2023 has caught many folks flat-footed, which is typically the case with the markets. Silicon Valley really threw a wrench into the expectations, feeding the doom-and-gloom crowd, and not for good reason.
Take all this with a grain of salt. More will be forthcoming this weekend and through next week on expected ’23 earnings. Currently the estimates look for full-year 2023 EPS growth of +1.2% on expected revenue growth of 3% – 5% (maybe). Expectations are so low and have been brought down sharply since July ’22, based on the fed funds rate hikes and QT.
Last year “exogenous shock” was Russia invading Ukraine, while in 2023 it’s undoubtedly the collapse of Silicon Valley Bank, although SIVB might not qualify as “exogenous”.
Inflation data continues to “disinflate”: all Jay Powell needs now is a weak(er) jobs report and it should seal the deal for fed funds rate reductions, but his biggest worry appears to be “reaccelerating inflation”.
Even though we saw higher-than-expected inflation data in September and January data, both eventually receded.
Take all this with a healthy skepticism. All data is sourced from Refinitiv (IBES data by Refinitiv) and past performance is no guarantee of future results. Capital markets can change quickly for both the good and bad. Data is always incomplete and usually revised down the road. If you are looking for certainty, it’s rarely found in investment management.
Thanks for reading.