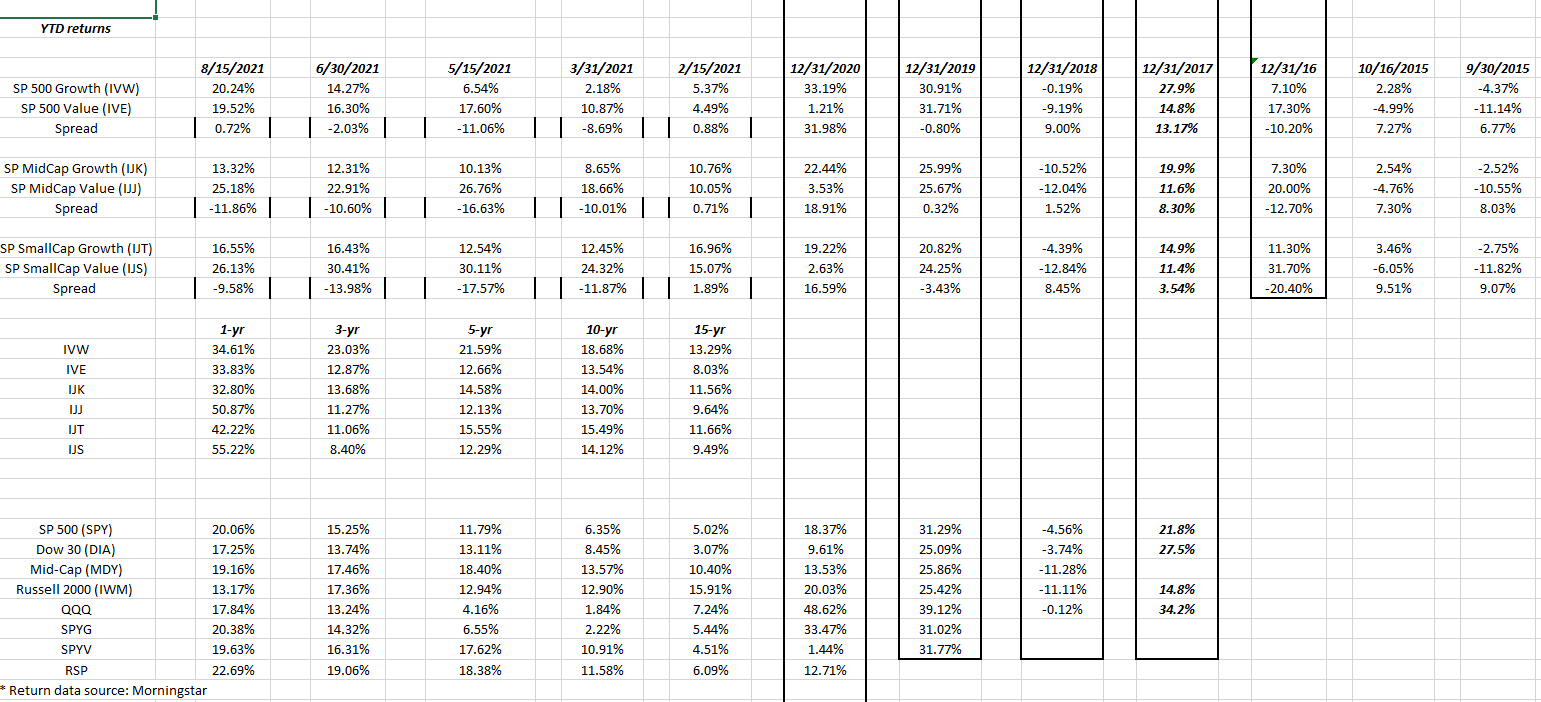
This spreadsheet is a little “busier” than I’d wanted for readers, but the border areas show full-year returns by “style” (i.e. large-cap growth down to small-cap value, while the middle section is new this quarter and shows rolling 1,3,5, 10 and 15 year returns, and the final bottom third of the spreadsheet simply shows YTD returns for various equity indices.
Here’s what stuck out in terms of the data:
- Since June 30th, 2021, large-cap growth has reasserted it’s leadership, if only slightly, over large-cap value, even though for the small and mid-cap asset classes (SMID) value is still out-performing year-to-date.
- Growth outperformed value for 4 straight years from 2017 to 2020, and that has begun to shift.
- Looking at the bottom third of the spreadsheet and SPY in particular, the SP 500 has now – at least YTD in 2021 so far – seen +20% gains in 4 of the last 5 years. Only in 2018 – with the SP 500 falling -4%, and all of that in the 4th quarter of 2018 – has the SPY not seen a 20% year.
- Looking at the “3-year” returns in the middle of the spreadsheet, value still lags geowth, but the double-digit returns are still healthy.
Summary / conclusion: Meeting with clients for the first half of 2021 performance reviews, each meeting with a client should be started with a little song and dance routine singing “nowhere to run to baby, nowhere to hide”. Of course clients don’t want to hear me sing, but readers get the point.
This is the “everything is going up” market, thanks to the Fed liquidity and Congressional stimulus post April 1, 2020.
Using the Ycharts calculator, from March 23, 2020, to August 13th, 2021, the SP 500’s total return is/was 103%. Think about that.
The biggest change made in accounts this year has been jettisoning the VWO or Vanguard’s EM ETF, which was China company-heavy, and adding, but not fully replacing the VWO, with the EMXC or Emerging Market ex-China ETF. (The problem with the EMXC is that it’s top two positions or 15% of the EMXC market cap is Taiwan Semi and Samsung, two large-cap tech companies.)
From a longer-term perspective, Emerging Markets is one of the few asset classes with mid-single-digit 10-year and 15 year returns versus much higher returns for US equity asset classes above. However, in the EM benchmark, China is roughly 1/3rd of the entire benchmark by market cap, and after what the CCP has done in Hong Kong, and to Alibaba and Jack Ma, it’s difficult to have any direct China exposure whatsoever.
While the face-ripping rallies of the late 1990’s are nowhere in evidence in this stock market today, and market breadth remains decent, the US stock market needs a correction badly.
Remember, take everything you read on financial blogs with great skepticism and a grain of salt. None of the above should be construed as advice, but rather observations based on long-term historical return data. It can all change in an instant, as we found out with Covid-19.
Thanks for reading.