If you listen to most commentary around SP 500 earnings, it is usally negative (for good reason) particularly since mid-2012, as year-over-year growth for the SP 500 has slowed dramatically, off the productivity-driven earnings expansion following the Great Recession of 2008 – 2009.
Current consensus estimates for the next two years is looking for between 8% and 11% earnings growth for the SP 500 for 2014 and 2015, based on current bottoms-up and top-down consensus.
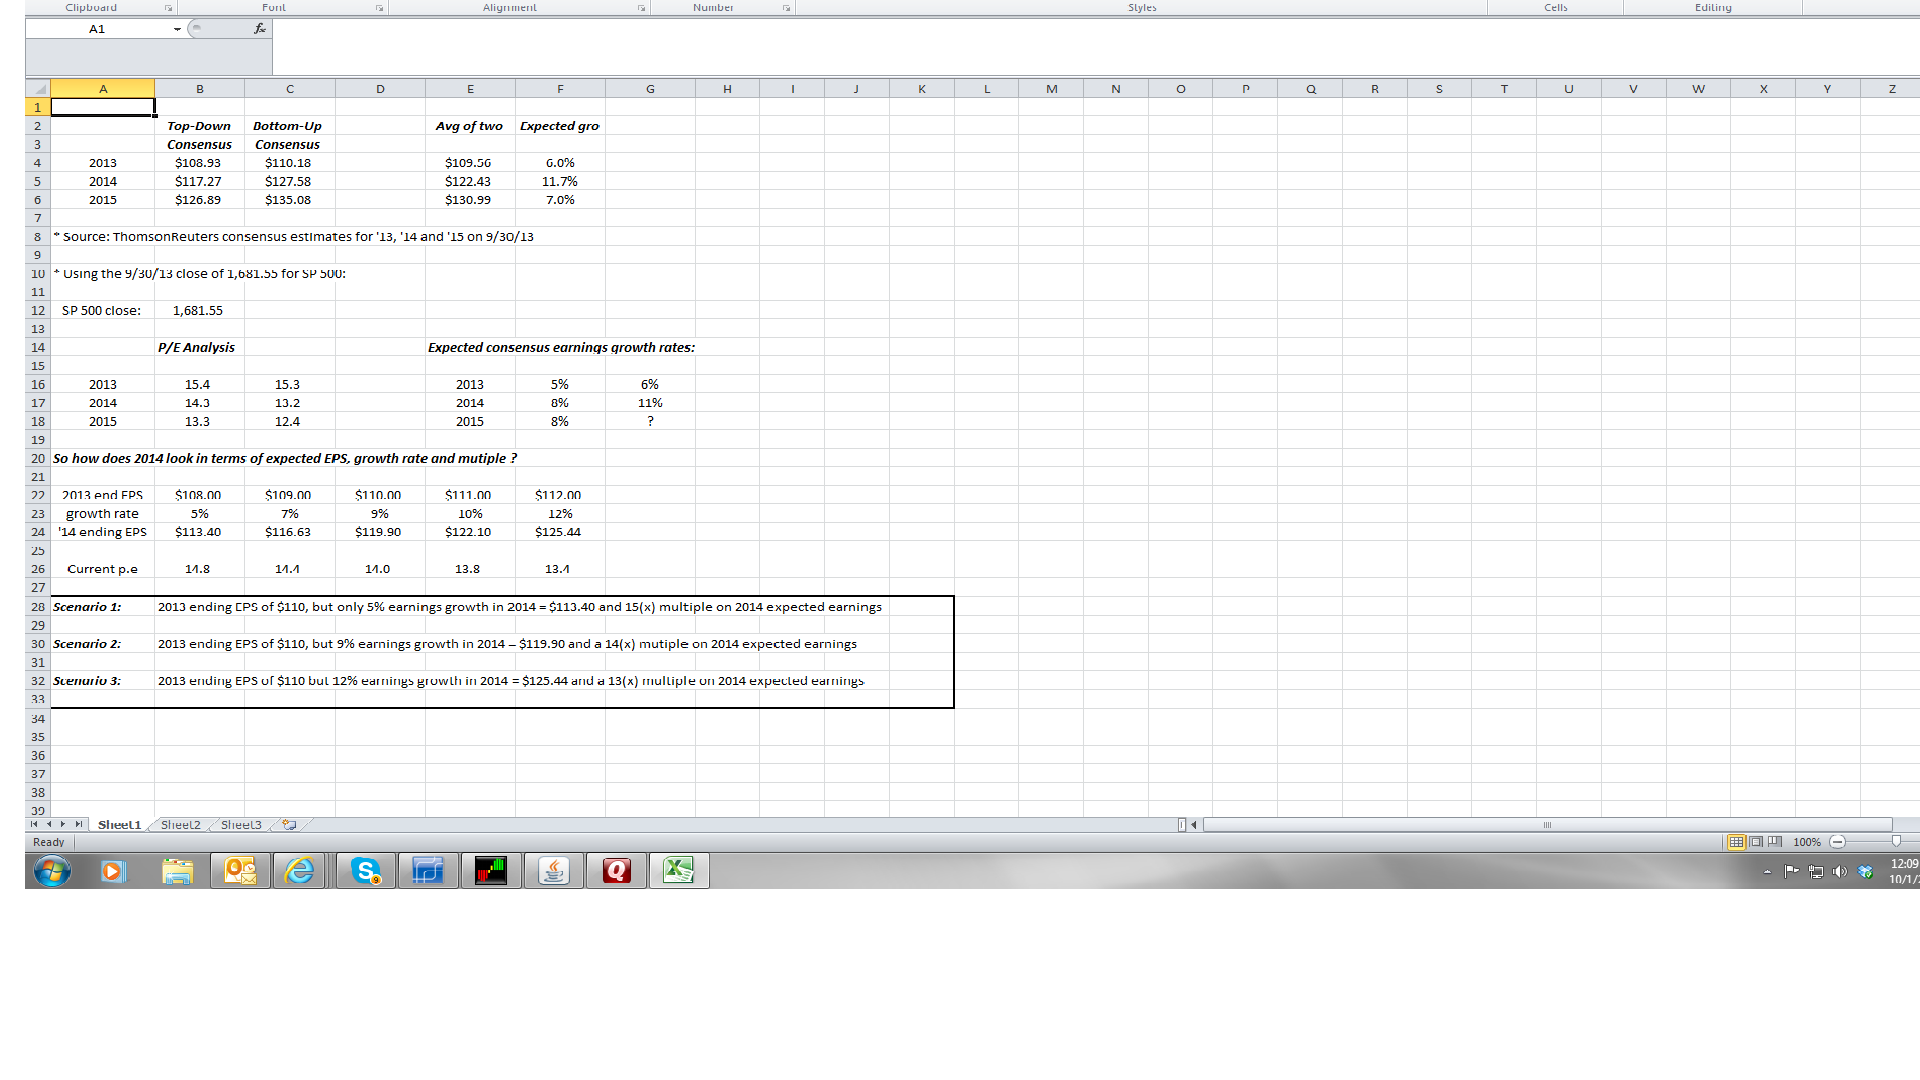
The above spreadsheet works out what the full-year 2014 final EPS estimate could be, based on the various growth rates.
As you can quickly see from the spreadsheet, the difficult metrics to quantify or rationalize are the “expected growth rate” of 2014 SP 500 EPS, and even more difficult to quanify, what p.e multiple the market assigns to those earnings.
For instance, 2013 SP 500 earnings growth is expected to be 6% – 7%, but the SP 500 is up 20% year-to-date, which implies some p.e expansion in 2013, which we have gotten. An SP 500 trading at 14(x) forward earnings, but growing at 7% is stretched on its PEG ratio, but the fact is earnings expectations have been too pessimistic, and actual earnings have been coming in ahead of unduly-severe analyst expectations coming into each earnings season.
So what is the point of all this ? I think that 2014 earnings growth could be slightly faster than 2013’s 6% – 7%, thus if the SP 500 can generate 9% – 10% earnings growth next year, and the SP 500 multiple does expand to 18(x) – 20(x) that growth rate, then the SP 500 is undervalued by 30%.
As the numbers look right now, the SP 500 looks pretty fairly valued, which is probably why astute investors like Warren Buffett and Bill Miller (and even Doug Kass remarked in early ’13, the SP 500 look fairly valued) are saying that it is more difficult to find bargains in today’s stock market.
Frankly I was suprised the SP 500 has the return it has in 2013 YTD, given the earnings growth rate for the SP 500.
Although the calculation isn’t on the above spreadsheet, let’s say 2013 ending EPS is $110 (which is statistically a reasonably certain outcome), and SP 500 EPS grows 10% in 2014, for an ending EPS of $121. A 10% growth rate for earnings at a 2(x) PEG implies a 20(x) multiple for the SP 500 on those ending earnings, or an ending value for the SP 500 of 2,420, which is a 30% discount to the current 1,680 SP 500 value today.
Earnings growth and p.e expansion are what really generate strong equity bull markets, and the fact is we haven’t seen much of either the last 2 – 3 years. Given the political rancor, and the constant bashing of the Fed, (which in my opinion is really combating what are the horrid, anti-business fiscal policies coming out of Washington), if I were running a 50 to 2,000 employee small business, I would continue to batten down the hatches and try and wait Washington out. If I were a Fortune 500 CEO or CFO, I’d be lowballing and trash-talking the coming 12 months like you wouldnt believe, and then beating the numbers (a practice called UPOD, or “under promise and over-deliver” on Wall Street.)
I think Q4 ’13 earnings and guidance, and what companies start to say (in October) about 2014 will be a big determinant of earnings revisions for 2014.
The post WW II long-run earnings growth rate for the SP 500 is 7% over the last 60 – 70 years. We are growing right in line with that today, even though the death of communism and socialism (as social and economic models) has opened up the world to capitalism and free-trade, more so than any other time in history.
We’ll keep you posted.
Trinity Asset Management, Inc. by:
Brian Gilmartin, CFA
Portfolio manager