With yesterday’s post, the SP 500 earnings data was not posted.
SP 500 earnings data (by the numbers):
Using forward earnings data:
- Fwd 4-qtr est: $172.51 vs last week’s $172.90
- Fwd PE: 18x
- Fwd PEG: 43x (will explain this further down)
- Fwd SP 500 earnings yield: 5.53% vs last week’s 5.59%
- Year-over-year growth of fwd est: +0.42% vs last week’s +0.42%
- (It’s important that readers understand that the “y/y growth of the forward estimate (last bullet point) measures the “forward estimate” today vs. 52 weeks prior. The low number of 0.42% means that there has been little change in the forward estimate the last 52 weeks (pretty amazing, no ?), hence the very high PEG ratio, which is calculated as “18x PE divided by 0.42%” or 43x.
Using trailing earnings data:
- TTM EPS est: $163.92 vs $163.84 (technically this is still an estimate because it includes the Q3 ’19 earnings data still being reported)
- PE ratio: 19x
- PEG ratio: 3.45x
- TTM SP 500 earnings yield: 5.25% vs last week’s 5.30%
- TTM y/y growth: 5.24% vs 5.53% (calculated by dividing the forward estimate of $172.51 by the 4-tr trailing est of $163.92)
This trend while still early is worth watching:
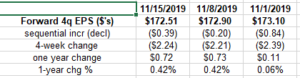
Note the 1-year change % – it hasn’t made a new low in the last three weeks.
The stat doesn’t sound like much but since the week of September 21, 2018, where the “1-yr chg %” peaked at 22.92% (influenced quite heavily by tax reform), the trend has been straight down for 61 weeks, with the exception of 4 weeks in May ’19 when it was flat-to-higher. (Guess when the SP 500 peaked at 2,940.91 before the 20% Q4 ’18 correction ? Yep, September 21, 2018.)
This is a wonky stat and to my knowledge this is the only blog that tracks it (or has tracked it for 20 years) and the statistic isn’t well understood, but it really measures the “rate of change” of the forward estimate.
If the trend continues higher, it bodes positively for the SP 500.
Leon Cooperman was on CNBC earlier this year and thought calendar 2019 SP 500 earnings would be $171 – $172 per share. The current estimate today is $162.77 and we still have Q4 ’18 earnings to get through. Tax reform heavily distorted 2018 SP 500 earnings which then distorted 2019 earnings.Calendar 2019 earnings will likely come in around $161 – $162 per share.
Summary / conclusion: Looking at the data, I hadn’t realized the “forward estimate” y/y change peaked the same week as the SP 500 in late September. 2018. It’s easy to get lost in this wonky world, and if the data is stared at long enough, it can mean whatever we want it too.
The goal of this morning’s blog was not this, but the data was missing from yesterday.
Let’s focus on that forward estimate rate of change the next few weeks and see if it has bottomed.
Thanks for reading.