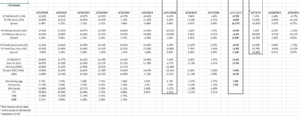
This “style box” update is refreshed every 6 weeks for readers so that the various market caps and styles can be tracked in terms of market leadership.
While there was a sudden and sizable rotation from Growth to Value during the week of September 13th, only Small Cap Value has beaten it’s Small Cap Growth counterpart for the majority of 2019.
However, as the spreadsheet indicates, the Growth out-performance (or alpha) for both Large and Mid-Cap styles has narrowed considerably during the 3rd quarter of 2019.
Can we expect Value to continue to close the performance gap ? Hard to say – this blog’s author would benefit from that rotation given the concentration in Financial’s in the top 10 of client holdings, but we have portfolio’s split between the Value and Growth styles for this reason.
Small-Cap Value
One of this blog’s favorite technician’s – Gary Morrow (@garysmorrow) – has written about the improving technical posture of the IJS:
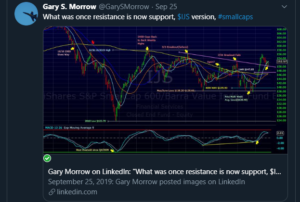
Here is a weekly chart of the IJS:
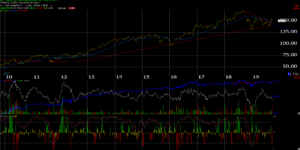
In 2018, the IJS was having a pretty good year until the 4th quarter correction, when it began to underperform the small cap growth ETF to a greater degree, and that seems to be the issue with small and midcaps of late. They generate positive returns when “the market” is in an uptrend, but when large-caps and the SP 500 corrects, the small and mid-cap space has sharper drawdowns.
This requires further study on my part but it kept me out of the IJS and other value ETF’s even with the uncertainty around the market in general.
Summary / conclusion: The Value-to-Growth rotation in early to mid September, garnered a lot of press and attention but we’ll see if it holds. Floating around Twitter there have been some charts and graphs showing a 20-year out-performance of Growth vs Value, but as the spreadsheet shows, it was 2016 where Value across all caps showed the last strong out-performance vs the Value sector, and that was a year where SP 500 earnings were subdued and the dollar (UUP) was weaker or didn’t make new yearly highs until late in the year.
As the spreadsheet shows, there was significant alpha generated from owning Value across all the caps in 2016.
I’m thinking ouy load today – don’t hesitate to throw out your thoughts and opinions.
Thanks for reading.