Saturday’s blog post declaring that the SP 500’s “earning yield” as of Friday, December 14th’s close, was the highest since early January ’16.
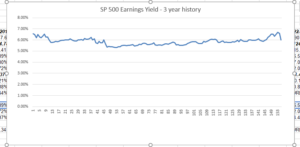
Here is a brief history of the earnings yield over the last 3 years:
- The EY spiked to 6.52% in late October ’18, closing the week of 10/26/18 at 6.52%, coinciding with the SP 500 lows at 1,603 that week;
- For most of 2018, the SP 500 earnings yield has traded between 5.75% and 6.10%, remarkable consistency although the SP 500 up to early October, was remarkably stable as well.
- For the first five weeks of 2018, up until February 9th, the SP EY rose from 5.40% in early Jan ’18 to over 6% by February 9th.
- For 2017, the EY gravitated between 5.80% in early ’17 to 5.35% later in the year after the 21% rally in the SP 500 for calendar 2017.
- For early 2016, the SP 500 earnings yield spiked to 6.68% and remained elevated for most of Q1 ’16 between 6% and 6.50%.
- For the rest of 2016, from April 1 forward, the SP 500 earnings yield gravitated between 5.75% and 6%.
Here is a graph of the SP 500 Earnings yield prepared from the Excel spreadsheet which tracks such data, showing the range of the EY the last 156 weeks or 3 years:
Summary / conclusion: Like all market metrics, the SP 500 “earnings yield” is an imperfect timing tool for investors. However in the 2015 – 2016 correction, as the SP 500 earnings yield spiked into the 5.50% – 5.60% range as it has now done at the October ’18 lows and with last Friday’s close, the yield is a good indicator of relative value.
Can the SP 500 EY go higher ? Absolutely – I took a look at the late 2011 earnings yield after the SP 500’s 20% correction from May ’11 through early October, 2011 and the EY shot up from 7.75% to over 9%. Even Dr. David Kelly, JP Morgan’s chief economist noted the SP 500’s elevated earnings yield when he came through Chicago in July, 2012, when the SP 500 EY was between 8% and 8.50%.
My own thinking of the SP 500 EY as a valuation indicator is that it’s still indicating the relative attractiveness of the SP 500 over bonds, and that as we look at the market during a horrible December ’18, either we are going to see a plethora of negative earnings pre-announcements shortly, or the SP 500 should find a bid given the forward estimates.
So far SP 500 “price” is falling faster than the forward estimate (which is also gradually reflecting slower earnings growth as expectations are tempered for 2019) which is driving the SP 500 earnings yield higher.
The SP 500 is down 1% for calendar ’18 YTD and is down 10% – 11% from the late September ’18 highs.
Take it as one opinion, but this SP 500 pullback is still more likely to be an ordinary pullback than the start of a bear market.
Thanks for reading.