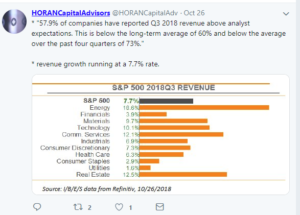
David I. Templeton of Horan Capital Advisors out of Cincinnati, posted this Q3 ’18 SP 500 revenue update to Twitter (@HoranCapitalAdvisors) on Saturday, October 27th, 2018.
It’s important info, but to supplement David’s work, let’s take a look at 4th quarter ’18 “expected” SP 500 revenue as well as 2019 SP revenue and more importantly, let’s see if there are any material changes to the sector growth rates based on Q3 ’18 SP 500 earnings already released.
Q4 ’18 expected SP 500 revenue growth rates by sector: (expected growth rates are as of 10/26/18 and then 9/30/18)
- Energy: +15.6% vs 13.7%
- Communications: +13.6% vs 12.6%
- Real estate: 10.8% vs 10.7%
- SP 500: 6.3% vs 6.3%
- Industrials: 6% vs 6.6%
- Health Care: 5.7% vs 5.8%
- Basic Mat: 5.7% vs 5.7%
- Consumer Disc: 5.5% vs 6%
- Technology: 5.1% vs 5.2%
- Financials: 4.6% vs 4.9%
- Cons Staples: 2.4% vs 2.4%
- Utilities: -4.7% vs -4.9%
(Source: Factset Earnings Insight as of 10/26/18)
With 240 of the SP 500 having reported Q3 ’18 results, maybe more importantly, how have expected 2019 revenue growth rates by sector changed in the last 4 weeks ?
- Comm Services: 9.6% vs 9%
- Energy: 7.1% vs 5.7%
- Consumer Disc: 6.3% vs 6.6%
- SP 500: 5.4% vs 5.3%
- Industrials: 5.4% vs 5.3%
- Health Care: 5.3% vs 5.4%
- Technology: 5.1% vs 5.3%
- Real estate: 5% vs 5.1%
- Financials: 4.1% vs 4.3%
- Cons Staples: 3.4% vs 3.4%
- Utilities: 3.1% vs 2.6%
- Basic Mat: 2.8% vs 2.8%
(Source: Factset Earnings Insight)
What was surprising about the above data ?
The SP 500 revenue growth rate for full-year 2019 actually ticked higher despite the market action. Still expected 5% revenue growth in 2019 is a material slowdown from what will likely be 8% revenue growth in 2018.
Within the newly-created Communications Services sector (ETF XLC), Google and Facebook are roughly 39% of the XLC by market cap. They are the big dogs in the yard (sector) so let’s watch Facebook’s revenue estimate revisions after they report this week and see if the sector expected revenue growth rates change.
Also, the fact that Energy has shown continued robust and “above-benchmark” revenue and EPS growth and still can’t get much traction in terms of sector performance is and has been puzzling.
But the big surprise is that there haven’t been many material changes to the Q4 ’18 and 2019 SP 500 revenue growth rates DESPITE the Nasdaq having its worst month since 2008 (as CNBC never tired of telling us last week).
So what’s the point of all this ?
Let’s look at historical SP 500 y/y revenue growth rates since 2015:
- Q3 ’18: +7.6% (estimate as of 10/26)
- Q2 ’18: +10%
- Q1 ’18: +7.3%
- Q4 ’17: +8%
- Q3 ’17: +6%
- Q2 ’17: +5.3%
- Q1 ’17: +7.7%
- Q4 ’16: +5%
- Q3 ’16: +2.7%
- Q2 ’16: -0.2%
- Q1: ’16: -1.5%
- Q4 ’15: -4.1%
- Q3 ’15: -3.9%
- Q2 ’15: -3.4%
- Q1 ’15: -2.9%
Q3 ’18 revenue will see its first “sequential” slowdown from +10% in the q2 ’18 to an expected 7% growth rate in Q3 ’18, for the first time since mid 2017.
Is that the market “issue” right now ? Could be – my own opinion is the US dollar is probably having an impact on SP revenue as it did from early ’15 through early 2016. When crude oil started to collapse from $90 as of Q3 ’14 to $28 by early ’16, the dollar had one of its more dramatic periods of strengthening from late ’14 through March ’15 that impacted SP 500 revenue and EPS. The dollar’s strength has been far less robust this year but it has been trending higher over time.
Summary / conclusion: Let’s end with a hypothetical today: if SP 500 earnings growth is 10% in 2019 and revenue growth is 5%, is the SP 500 fairly valued at 2,658 ? Probably, at 15x forward earnings with an expected 10% SP 500 EPS growth rate in 2019, which already incorporates a slower expected SP 500 EPS growth rate given the lapping of the reduction in the corporate income tax rate, expectations have already factored in a slower 2019.
Q2 ’18 will likely be the peak for SP 500 revenue growth given the Fed rate hikes and the China trade issues, and I’d like to see both taken off the table in the next few months.
But as readers can see from the Q4 ’18 and 2019 Factset revenue expectations, the revisions to the forward revenue estimates are not (yet, anyway) very material.
Given Apple’s weight in the SP 500 and the Tech sector, I do think how they guide for their fiscal ’19 in terms of expected revenue growth will be important for the market. It could tell us much about China, trade and what is happening beneath the headlines. Apple’s November 1 earnings release is critical, and as was addressed Friday on this blog, the numbers look good.

We’ll leave readers a chart from Friday’s October 26th, 2018, Bespoke Report that displays graphically how the Q3 ’18 SP 500 revenue “upside surprise” (or so-called “beat rate”) looks relative to history.
Check the Factset 2019 expected SP 500 revenue growth rates by sector table: note how the SP 500 revenue growth rate ticked slightly higher for 2019 after the drubbing last week, and despite the lower beat rate.
Perhaps the SP 500 revenue slowdown is already discounted in the market.
Thanks for reading.