The above link is a new spreadsheet comparing the “4-quarter trailing” SP 500 earnings yield and the “forward 4-quarter” SP 500 earnings yield.
Readers have asked about the 4-quarter trailing SP 500 EPS earnings yield, but the time was never taken to build and compare the data.
The goal of the comparison was to see if there were any periods where the trailing or forward yields would indicate a “tell” for the SP 500, possibly for overvaluation purposes or for market direction.
Table 3 calculates the difference between the two earnings yields.
To further complicate the issue, here is Ed Yardeni’s “SP 500 Earnings Yield” Chart from 10/11/18. (Readers have asked for a chart too.)
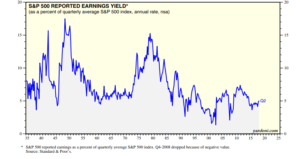
Summary / Conclusion: What struck me about table 3 or the difference between the forward and trailing earnings yields was that the difference between the two remained relatively constant over the 14 years, from 2004 to 2018, with the exception of 2008 (naturally). One of the aspects about 2008 – 2009 recession was that the downturn was not the typically “normal” economic downturn. The Great Recession started in the Financial system and worked its way outward, while the typical economic business cycle starts with a macro slowdown and works it’s way inward.
Think of 2001 – 2002: that was an overvaluation and earnings-driven recession, limited to the Tech sector and many aspects of the economy went unscathed, particularly since the consumer spending remained quite strong.
In fact it has probably been a few decades since we have seen what could be called a normal business cycle and a normal economic downturn where forward SP 500 earnings would have some kind of a predictive ability.
That’s just an opinion, or rather an observation, not necessarily based on academic rigor.
Bottom-line, every time the SP 500 earnings yield has been over 6% since post-2008, it has generally meant the SP 500 has found a solid bid. In 2012, when the SP 500 earnings yield hit 7.5% during the summer of 2012, it didn’t mean we saw a scorching rally, it just meant we didn’t see any kind of material sell-off.
Uncharacteristically, this blog made a market call with Friday night’s post, which I immediately regretted, but it is what it is. It’s still amazing how fast bearish sentiment appears, 10 years into higher stock prices.
Thanks for reading.