The Emerging Markets ended a 10-year bear market in Q1 ’16, as the EEM (iShares MSCI ETF) peaked in the $55 area in October, ’07, the VWO (Vanguard EM ETF) peaked near $58 in November ’07, where both bottomed in Q1 ’16 near $30 per share.
It was the China yuan devaluation in the summer of 2015, and then the bottoming of crude oil near $29 per share in early ’16 that drove the last downward spiral in the Emerging Market asset class.
Since that bottom in Q1 ’16, the EEM is up about 47% while the VWO is up 43% (using Morningstar performance data).
2017 was a monster year for both ETF’s as both outperformed large-cap Tech and Growth generating mid-30% total returns for 2017.
In 2018 YTD as of late May ’18, both the EEM and the VWO are flat in terms of returns.
So what now ?
The Emerging Market economies – and I have tough time believing that China is an “emerging market” when it is currently the world’s 2nd largest economy – comprise roughly 15% of global GDP.
Does that mean EM’s should constitute 15% of a well-diversified equity allocation within a client’s account ?
Client’s current EM weighting is roughly 3% to 7% of accounts, depending on the client and that will likely be increased over time.
After the 1980’s and 1990’s bull market ended in the early 2000’s, investors saw a mad rush into everything that didn’t work in the 1990’s like Emerging Markets, like commodities, like gold, like deep value (many of which were commodity names), and Emerging Markets performed very well for the period from 2001 through late 2007, certainly far better than the Tech-heavy SP 500.
Essentially “growth” became value and value, growth, once the 1990’s bull market ended, and much of this was due to the emergence of China.
And then EM’s didn’t (work well) from late 2007 through the first quarter, 2016.
EM’s were never owned for clients until Q1 ’16 to avoid making the same mistake with the EM’s and the commodity names as were done with Tech and Financials in the late 1990’s.
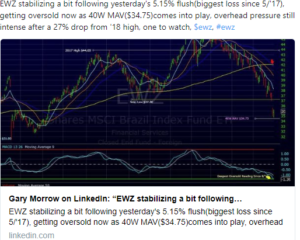
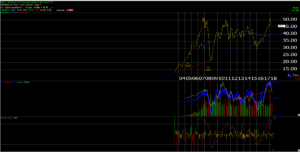
Conclusion: the two charts above are the Brazil ETF (EWZ) and the EEM. Brazil was owned off the Q1 ’16 low since it was the poster child for anything that was crushed at that time including energy exposure (Petrobras was one of the top holdings of the ETF, as well as some banks), weak currency, commodity-based economy, not to mention a government that seems constantly under indictment, from Rousseff, to Lula to Temer. The ETF has pulled back to long-term support at the 200-week moving average. If readers are disposed to some risk with Emerging Markets, Brazil is in a lower-risk buy area per the first chart from Gary Morrow. (The EWZ hasn’t yet been bought for any accounts but it could be by the end of June.)
The EEM and VWO are pretty similar EM ETF’s and I am hoping both pull back to the low $40’s to add to accounts.
The strong dollar is a reason given for the weakness in 2018, but the EM ETF’s actually seem somewhat-correlated to the SP 500 since the lows in Q1 ’16.
The while point of this blog post was to show that – relative to the secular bull market in US equities which started either March of 2009, with the lows near 670, or the new SP 500 all-time-high in April – May, 2013 – the “Emerging Market” bull market is just 2 years old. Granted there is more risk within these economies, but the fact is the major 10-year lows just occurred in the first quarter, 2016.
Thanks for reading.
SP 500 earnings data will be updated Saturday, June 2nd, 2018.