Boeing (BA) has been one of our big winners in 2013: after bottoming in the law $70’s last fall of 2012, with the battery news, the stock has now (almost) doubled in the last 15 months, and is up about 79% year-to-date alone, excluding the dividend.
The Q3 ’13 earnings release in late October ’13 was quite positive, as better-than-expected margins drove the EPS upside, and cash-flow was robust.
Here is a quick run-down for the valuation metrics as of 9/30/13, and with the stock trading near $135:
Expected EPS growth of 32% in 2013, up from the expected 23% at this time last year;
Revenue growth is expected at 4% in 2013, versus 3% at this time last year;
Earnings and revenue growth are expected at 12% and 9% in 2014, and those estimates have been stable;
BA’s price to cash-flow and price to free-cash-flow are 9(x) and 12(x) times respectively;
BA’s free-cash-flow yield is 9%;
The better-than-expected cash-flow has resulted in BA announcing a $2 bl share repo, although about $1 bl in options have been exercised by management;
We continue to like the stock although we’ve trimmed some from client accounts given the appreciation in 2013.
With the US, Japan, China and the European economies improving and the majority of US air carriers now profitable and financial healthy for the first time in years, the macro fundamentals should remain supportive of BA’s deliveries and capex for some time.
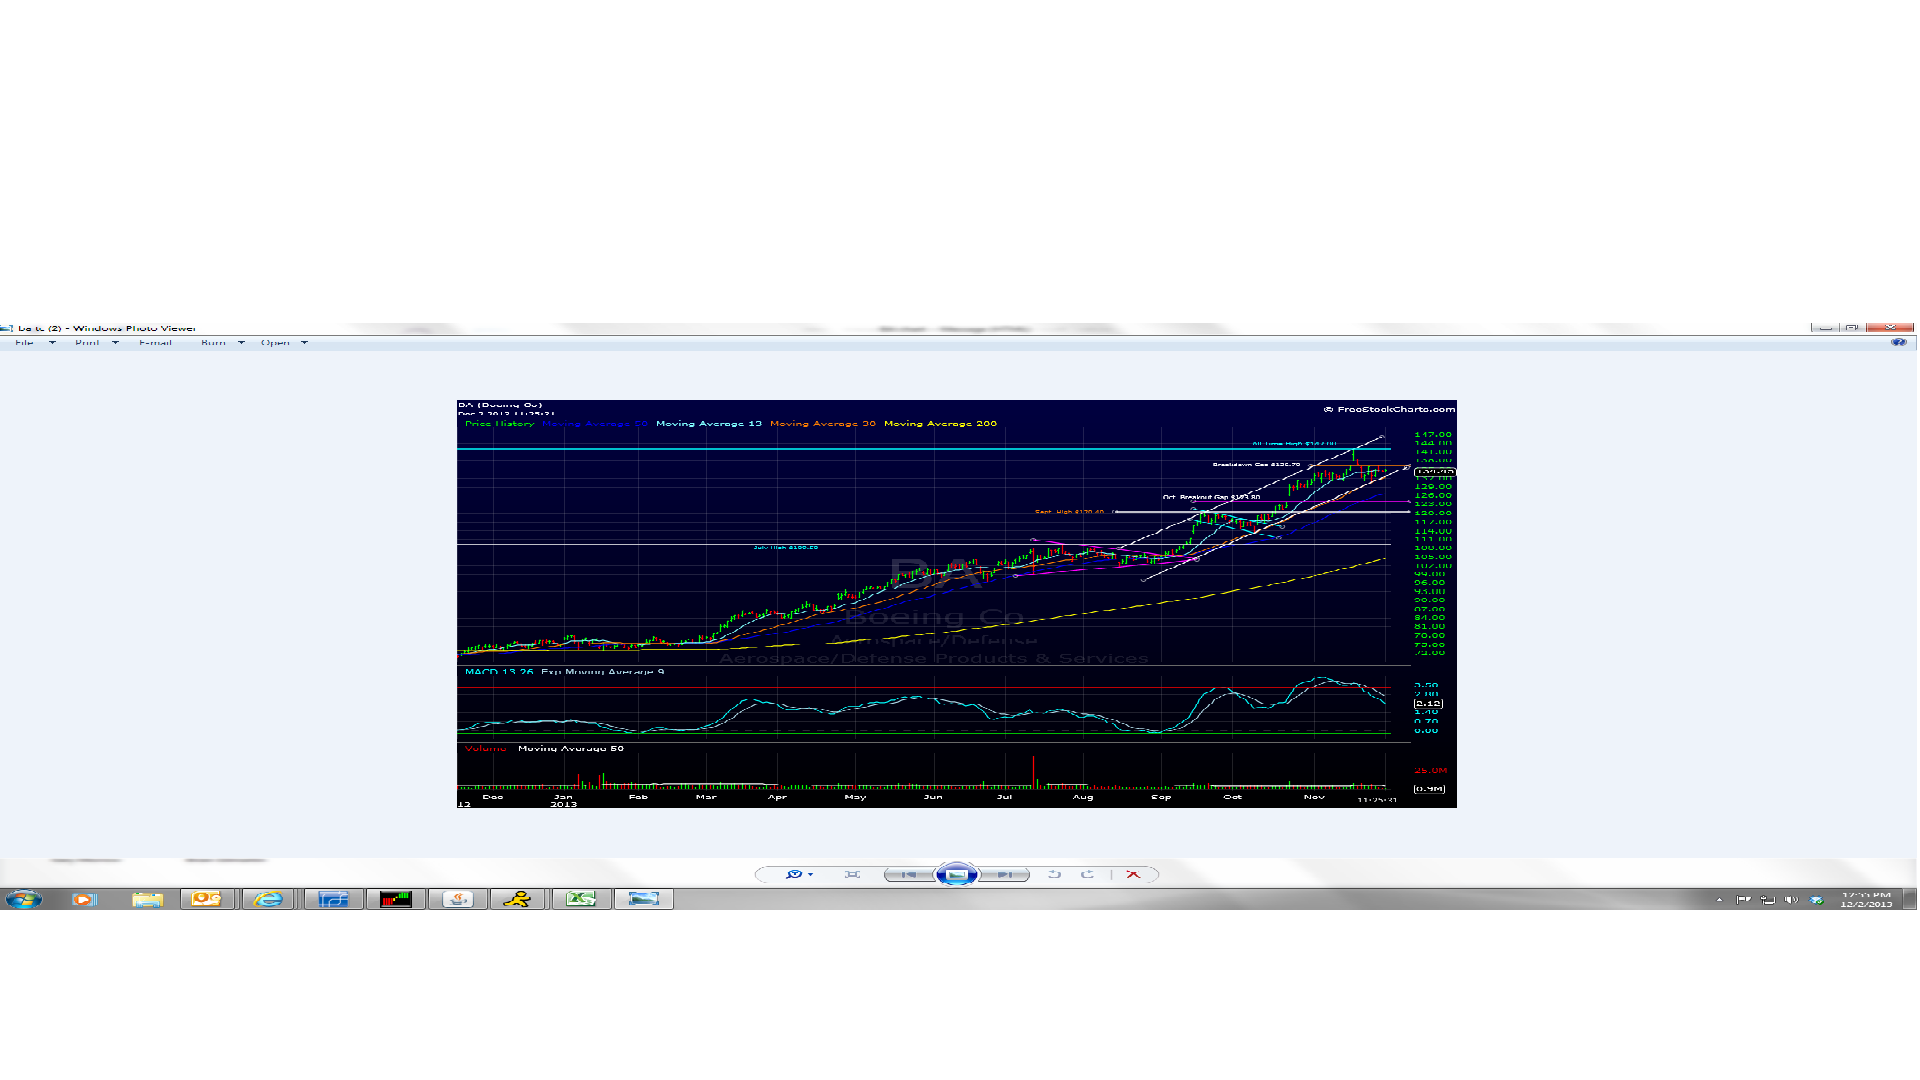
Technicals:
Technically, as per the above chart compliments of Gary Morrows of This Week on Wall Street, the stock is tired and needs a consolidation.
Here are Morrow’s comments about the current technical configuration of BA:
“Boeing begins a new month in a very weakened state. The stock is a mere 5% below its November peak but the powerful momentum that has driven an impressive three month rally has faded. Two weeks ago BA opened with a huge upside gap that lifted shares over 4% on news of a big 777X order. The stock was unable to build on the breakout move leaving behind an ominous spike high. Since then BA has attracted a pair of relatively heavy downside days that have left the stock rather vulnerable in the near term.
As Boeing left behind its post ‘Dreamliner fire’ consolidation in early September a very healthy bull channel began to form. BA rallied over 35% from the August close to last month’s spike high. Despite the drift lower over the lat two weeks the stock remains inside it bull channel. A drop below key support near the November lows would usher in a much deserved pullback. A break of the $130.00 area would mark BA’s first lower monthly low of 2013. This would likely lead to a wave of profit taking and a deeper pullback.
Boeing has a major band of support approximately 8% below current levels. The upper band of this key area includes the stock’s huge breakout gap left behind back on October 23rd at $123.80. The lower band is held by the September high near $120.50. A healthy base near this major support zone would offer a very low risk entry opportunity for patient bulls.”
We use two different intrinsic value models, to attempt to value a stock: our earnings-based model assigns an intrinsic value on BA of just under $400 per share, which I think is too aggressive. Morningstar’s discounted cash-flow model values BA at $120, which I think is too conservative. If BA should trade to the high $190’s or $200 at some point in the next few years, I think the stock would be pretty fully-valued or even overvalued given the cycle.
Here is an interesting aspect to BA’s long-term chart which caught our eye:
The 1990 high near $30 was eclipsed, and BA traded to $60 in 1997, or twice the 1990 high print;
Although the 2000 high near $70 eclipsed the ’97 high, it wasn’t until the October ’07 near $107 that BA made an all-time, which was twice the 1997 peak;
The 1990, and 1997 peaks coincided with international issues, with 1990 being the First Gulf War, and 1997 – 1998 being the SouthEast Asia currency devaluation (thai bhat and Malaysian ringgit);
Although the pattern doesn’t have to be the same, assuming that the next peak for the stock is 2(x) its previous high, a trade to $200 – $215, might not be out of the question for BA.
Just a thought…
Thanks for reading.
Trinity Asset Management, Inc. by:
Brian Gilmartin, CFA
Portfolio manager