It was exactly one week ago that IBM reported Q1 ’13 earnings, falling $17 or 8% last Friday, April 19th, on very heavy volume.
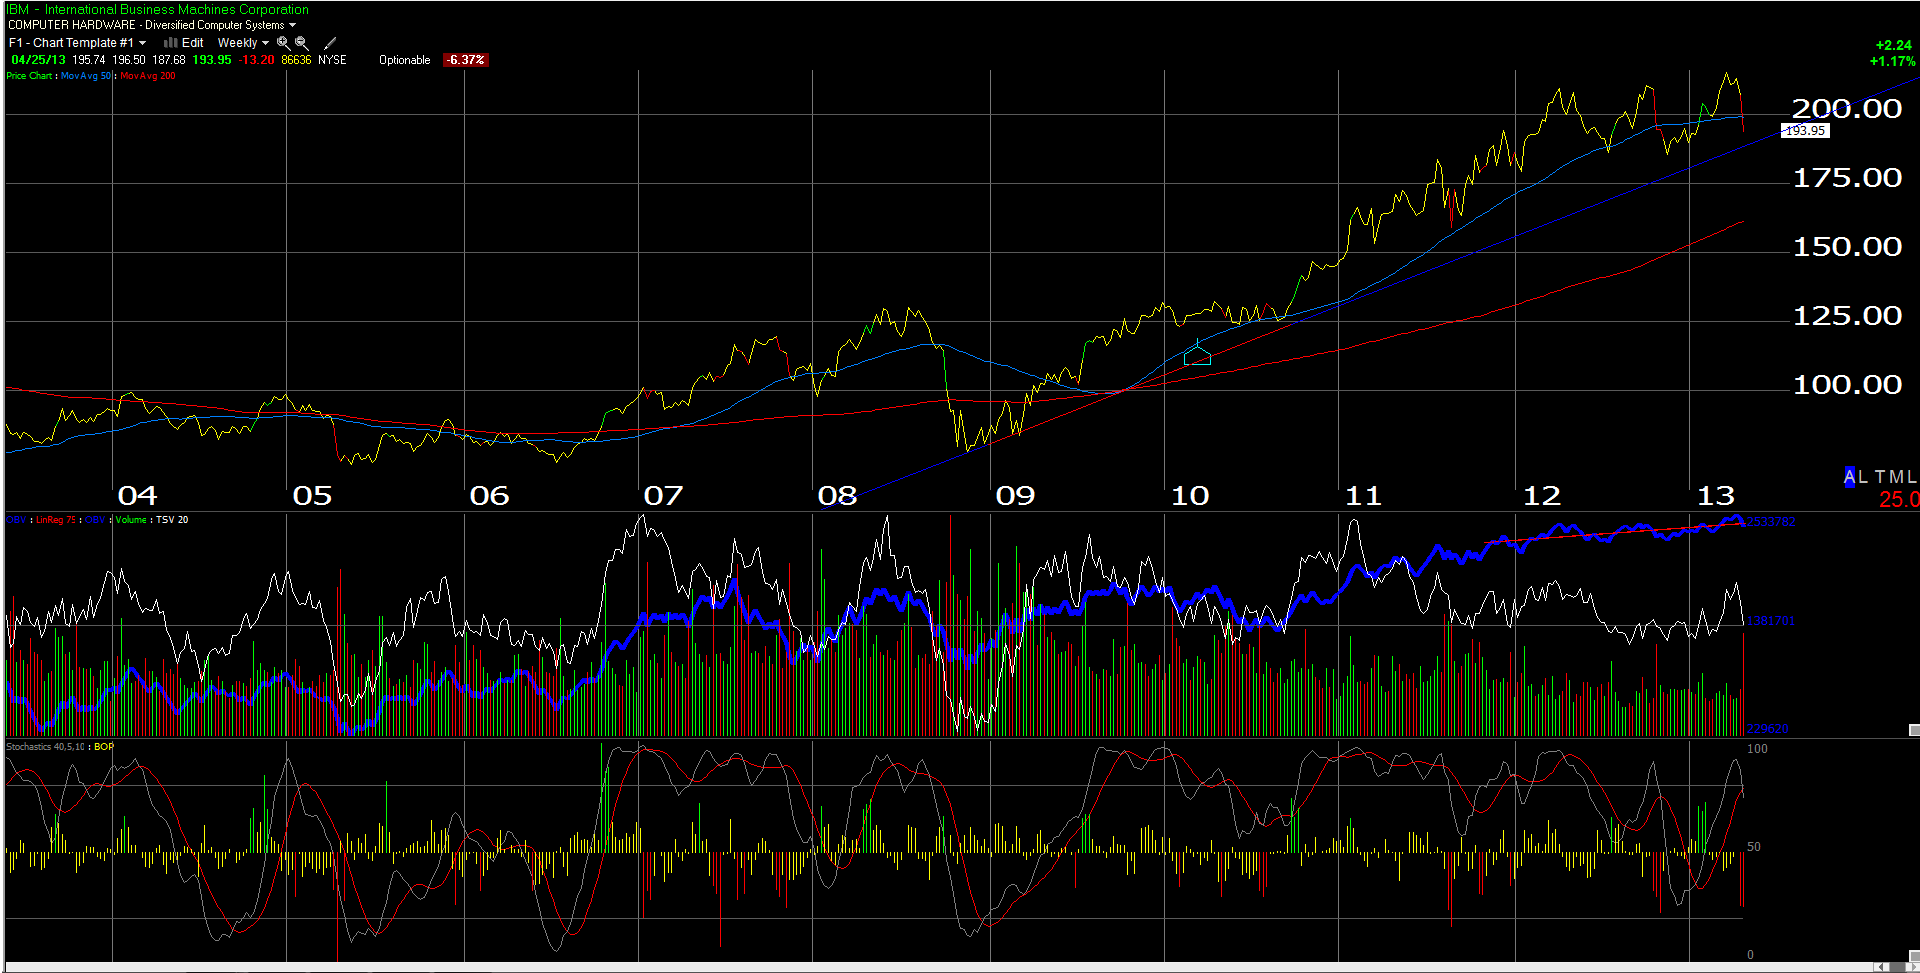
While this longer-term weekly chart shows the stock technically intact, since IBM has NOT taken out its longer-term uptrend line off the 2009 market lows, the fact is, IBM is no longer part of the market leadership as it was for the past few years.
Maybe it isn’t coincidence that despite both AAPL and IBM fading the last 6 months, the SP 500 has gone on to hit new all-time highs this quarter.
The US stock market and the SP 500 is “rotating” and the previous leaders are being left behind.
IBM is still technically in good shape, but we’ve been trimming the position on this bounce since the stock could languish for a while, as the SP 500 races higher.
Fundamentally, the key to IBM has been share repurchases which have been offsetting weak revenue growth, but IBM’s hardware business is in tough shape, and they are seeing more competition on software. Again, this doesn’t mean IBM is broken, it just means the stock may not lead the market.
We remain long IBM, just in smaller amounts. If the stock breaks out again, we may add to it, but I think that is a few quarters away.
Trinity Asset Management, Inc. by:
Brian Gilmartin, CFA
Portfolio manager