The “upside surprise” or beat rates for Q1 ’23 SP 500 earnings are quite strong, with the recent IBES by Refinitiv data showing the SP 500 EPS beating by 7.7% as of last night’s close (Thursday, 4/27/23) while SP 500 revenue is beating by +1.5%.
For some context, Q4 ’22 SP 500 EPS upside surprise rate was just 1%, while the SP 500 revenue upside surprise was +1.6%.
267 companies have report Q1 ’23 earnings per Refinitiv.
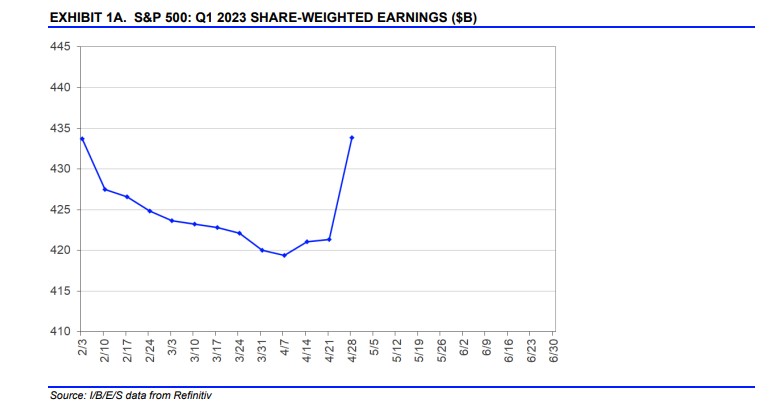
This blog cut-and-pastes this graph from the Refinitiv, “This Week in Earnings” report on occasion, to give readers a visual on how the actual trend in net income looks for the SP 500. (Refinitiv refers to this as the “share-weighted earnings” graph, but if you look at the Y-axis, it sure looks like that is “net income” along that vertical line.) This graph was cut-and-pasted from today’s (4/28/23) “This Week in Earnings Report”.
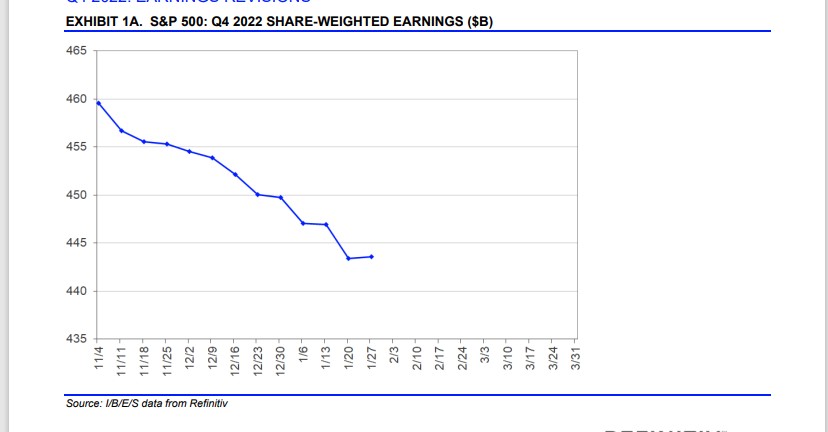
This graph was cut-and-pasted from the Jan 27th, ’23 report after big tech reported their results.
See the difference ?
SP 500 data:
- The forward 4-quarter estimate for the SP 500 increased a whopping $0.05 to $225.91 from last week’s $225.86 estimate.
- The PE ratio on the forward estimate is now 18.5x versus 3/31’s 18.6x and 12/31/22’s 17.2x;
- The SP 500 “earnings yield” as of this week’s end is 5.42% versus 3/31’s 5.37% and 12/31/22’s 5.81%
Weekly Change in Quarterly Growth Estimates for SP 500:
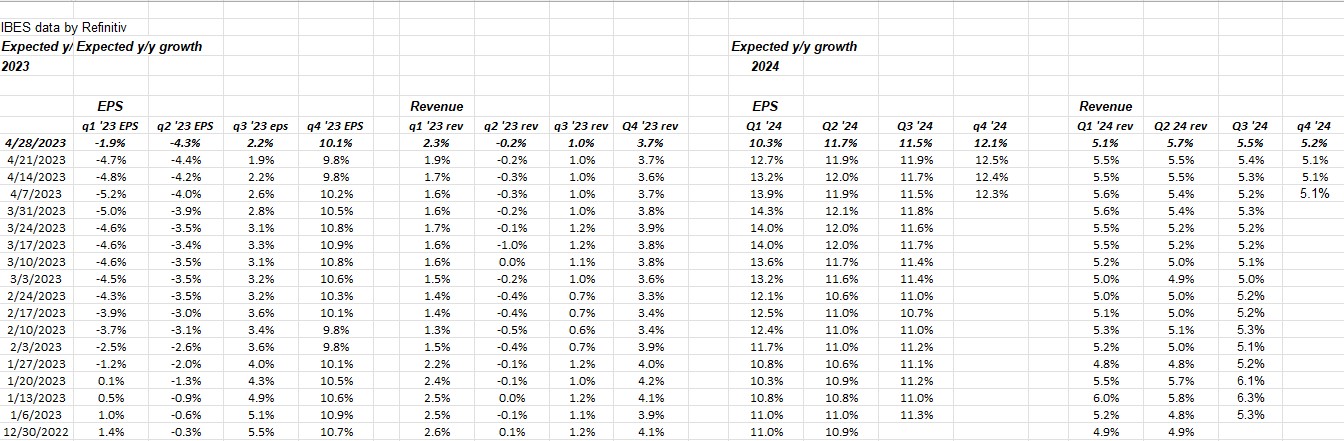
This table is helpful for readers to see the trend in quarterly SP 500 EPS and revenue.
Note the jump in Q1 ’23 EPS and revenue columns this last week.
Also note the trend in Q4 ’23 “expected” EPS and revenue trends, which have been remarkably stable in Q4 ’22 and Q1 ’23. (This blog posted on this expected Q4 ’23 growth rate behavior in March ’23 here.)
2-year Treasury yield into Wednesday’s FOMC meeting:
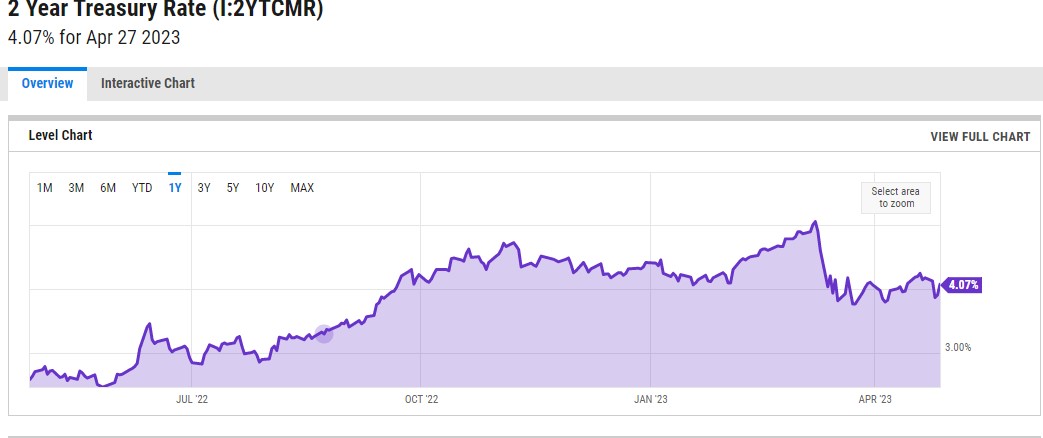
With the recent hotter inflation data (yesterday’s Q1 ’23 GDP deflator and this morning PCE Core), I was expecting the 2-year Treasury yield to head higher but as the attached chart from YCharts indicates, the 2-year Treasury has been hugging the 4% area since Silicon Valley Bank (SIVB) blew up. (What was surprising looking at the chart was that at one point “pre-SIVB”, the 2-year Treasury ticked above a 5% yield in early ’23.)
Looking at CME’s FedWatchTool, there is an 80% chance the FOMC hikes the fed funds rate another 25 bp’s on Friday, but – interestingly – the June 14th, 2023 futures, show the FOMC holding pat.
Can Fed Chair Jay Powell be hawkish and dovish in the same press release ?
For financials to work, the yield curve has to return to a normal slope, and that can only come from a lower fed funds rate, not necessarily higher, longer-maturity yields, since we would have seen that happen by now.
Trinity’s technician has talked about the KRE (regional bank ETF) holding $41, which is did this week, despite the bottom falling out of First Republic. The XLF (financial sector ETF) also looks to have bottomed.
Wednesday afternoon it’s “inflation vs regional bank risk” – which narrative prevails ?
Summary / conclusion: The SP 500 EPS upside surprise rate is way strong in Q1 ’23. A longer post will be done on the data, just so readers can see the history. There is only one sector that isn’t beating the estimates and that’s Real Estate with a -0.9% downside surprise rate. Consumer Discretionary (think Tesla and Amazon) has a whopping 21.6% upside surprise rate per Refinitiv, on a 3.1% revenue beat rate. (The only caveat being that this data might NOT include Amazon since Amazon reported Thursday night after the bell, April 27th, 2023, and typically the Refnitiv data cuts off as of Thursday night each week.)
No question the bearish expectations heading into earnings season significantly underestimated the SP 500 earnings strength, particularly in the consumer discretionary and technology sectors.
Bespoke has long written – for years – that earnings expectations coming into the reporting period are a good contrarian indicator of how earnings will actually perform relative to the consensus estimate.
A couple of pundits commented that the consensus, calendar, 2023 and 2024 SP 500 EPS estimates actually ticked higher this week, but don’t get overly excited yet: both those estimates are still down from the March 31 ’23 EPS estimates.
Take this all with a healthy skepticism. Past performance is no guarantee of futures results. All data is sourced from IBES data by Refinitv, although the data is taken and tracked, measured or otherwise manipulated on my own spreadsheets. Capital markets can change quickly for both the good and the bad. Be sure and have an understanding of your own appetite for market volatility.
Thanks for reading. More to come over the weekend.