In 2001 – 2002 the Nasdaq fell 80% from it’s March, 2000, high to its late 2002 low, with the primary driver being the complete collapse of the secular buildout of corporate technology that was a total bonfire for most of the 1990’s. Secular growth in PC’s and ultimately servers and server networks led to the internet explosion of the late 1990’s with the Netscape IPO in 1995, and then it flamed out in the early 2000’s. Interestingly, it was the flame-out of the corporate tech buildout that coincided with the ascendency and turnaround of Apple (consumer technology) in the early 2000’s and the ultimate explosion of cloud, mobile, social networking, gaming and the “consumer” tech expansion of the last 20 years.
Only knowing this in hindsight and how it played out, there seems to be a lot of fear of a collapse in tech and megacap today since the tech concentrations in the top SP 500 market-cap weights, resemble corporate tech in the late 1990’s. Could it happen again ? Sure, lightning can strike twice but consumer tech seems far broader today than the corporate tech of the 1990’s. Also there is always an element on Wall Street and the mainstream financial media that “fights the last war”.
Personally, a lot the names previewed here look cheap “relatively” speaking since the group is coming off very tough compares from the Covid period, particularly in 2021, very tough currency translations given the dollar strength, worries about the US economy (which is so broad it’s almost pointless to mention), and the pressure of rising 10-year Treasury yields compressing PE’s even on higher-quality growth stocks.
Is mega-cap Tech bottoming ? Let’s avoid the prediction game and say the valuations look a lot better than 12 months ago, when some of the software names like Salesforce and Docusign and others started to weaken in Q4 ’21. Technology and “growth” started to weaken in the last 3 months of 2021. That’s a good sign for Q4 ’22.
If we include META in the mega-cap technology universe, there are 5 companies that will report their 9/30/22 quarters in the week of 10/24/22.
Here’s a quick look at YTD return for each stock as of 10/21/22’s close:
- Apple: -16.68%
- Amazon: -28.43%
- Alphabet: -30.18% (GOOGL), (-29.86%, GOOG)
- META: -61.35%
- Microsoft: -27.46%
- SPY: -20.28%
SP 500 Market cap Ranking:
- Apple: #1, 6.99%
- Microsoft: #2, 5.69%
- Amazon: #3, 3.30%
- Alphabet: #4, GOOGL, Class A 1.94%, #6 GOOG, Class C, 1.74%
- META: #15, 0.97%
Let’s work chronologically through the week:
Since clients are only long Alphabet Class A stock, (GOOGL): reports Tuesday, 10/25/22, after the market close (AMC)
As a framework or context, GOOGL shot the lights out in terms of y.y growth during late 2020 and 2021. Here’s the last 5 quarters y.y revenue and operating income growth for GOOGL, with the compares starting to get easier as we move into 2023.
- q2 ’22: Revenue: +13%, operating income +0%
- q1 ’22: Revenue +23%, operating income +22%
- q4’21: Revenue +32%, operating income +40%
- q3 ’21: Revenue +16%, operating income +88%
- q2 ’21: Revenue +62%, operating income +203%
After the 20-1 stock split, Street consensus is looking for $1.26 in EPS on $70.2 billion in revenue for expected y.y growth of -10% and 31% respectively. Operating income is expected to come in around $20 billion per one model, which would be y.y growth of -5% respectively. 31% revenue growth is still pretty solid. GOOGL has a tough compare in Q4 ’22 when Q4 ’21 printed a $75 billion revenue quarter.
In Q2 ’22, GOOGL met on revenue but missed on EPS as they did in Q1 ’22.
The revenue and upside surprise for GOOGL were shocking from June ’20 through December ’21 quarters: EPS “averaged” a 36% upside surprise during those 6 quarters, while GOOGL revenue averaged a 6% upside surprise.
EPS estimate revisions:
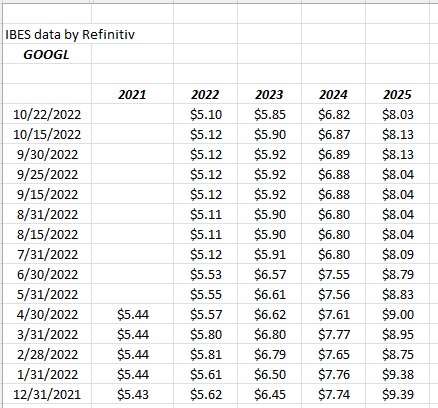
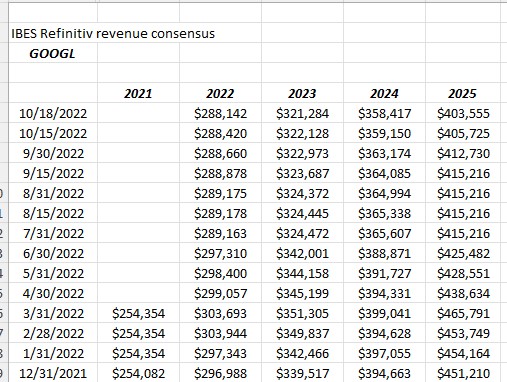
GOOGL’s EPS estimates for 2022 and 2023 are down about 10% from the 12/31/21 starting estimates, while the revenue estimates are down about 3% respectively, for 2022 and 2023.
Valuation: at roughly $100 per share, GOOGL is trading at 20x and 17x the 2022 and 2023 consensus EPS estimates of $5.10 and $5.85 but I don’t like the gradually negative revisions in the EPS. Trading at 5x revenue, and 13x and 19x cash-flow and free-cash-flow (ex-cash) and with a 5% free-cash-flow yield, the stock is cheaper than it was just a year or two ago, but the worries over “headwinds”, currency and advertising loom large.
Chart:
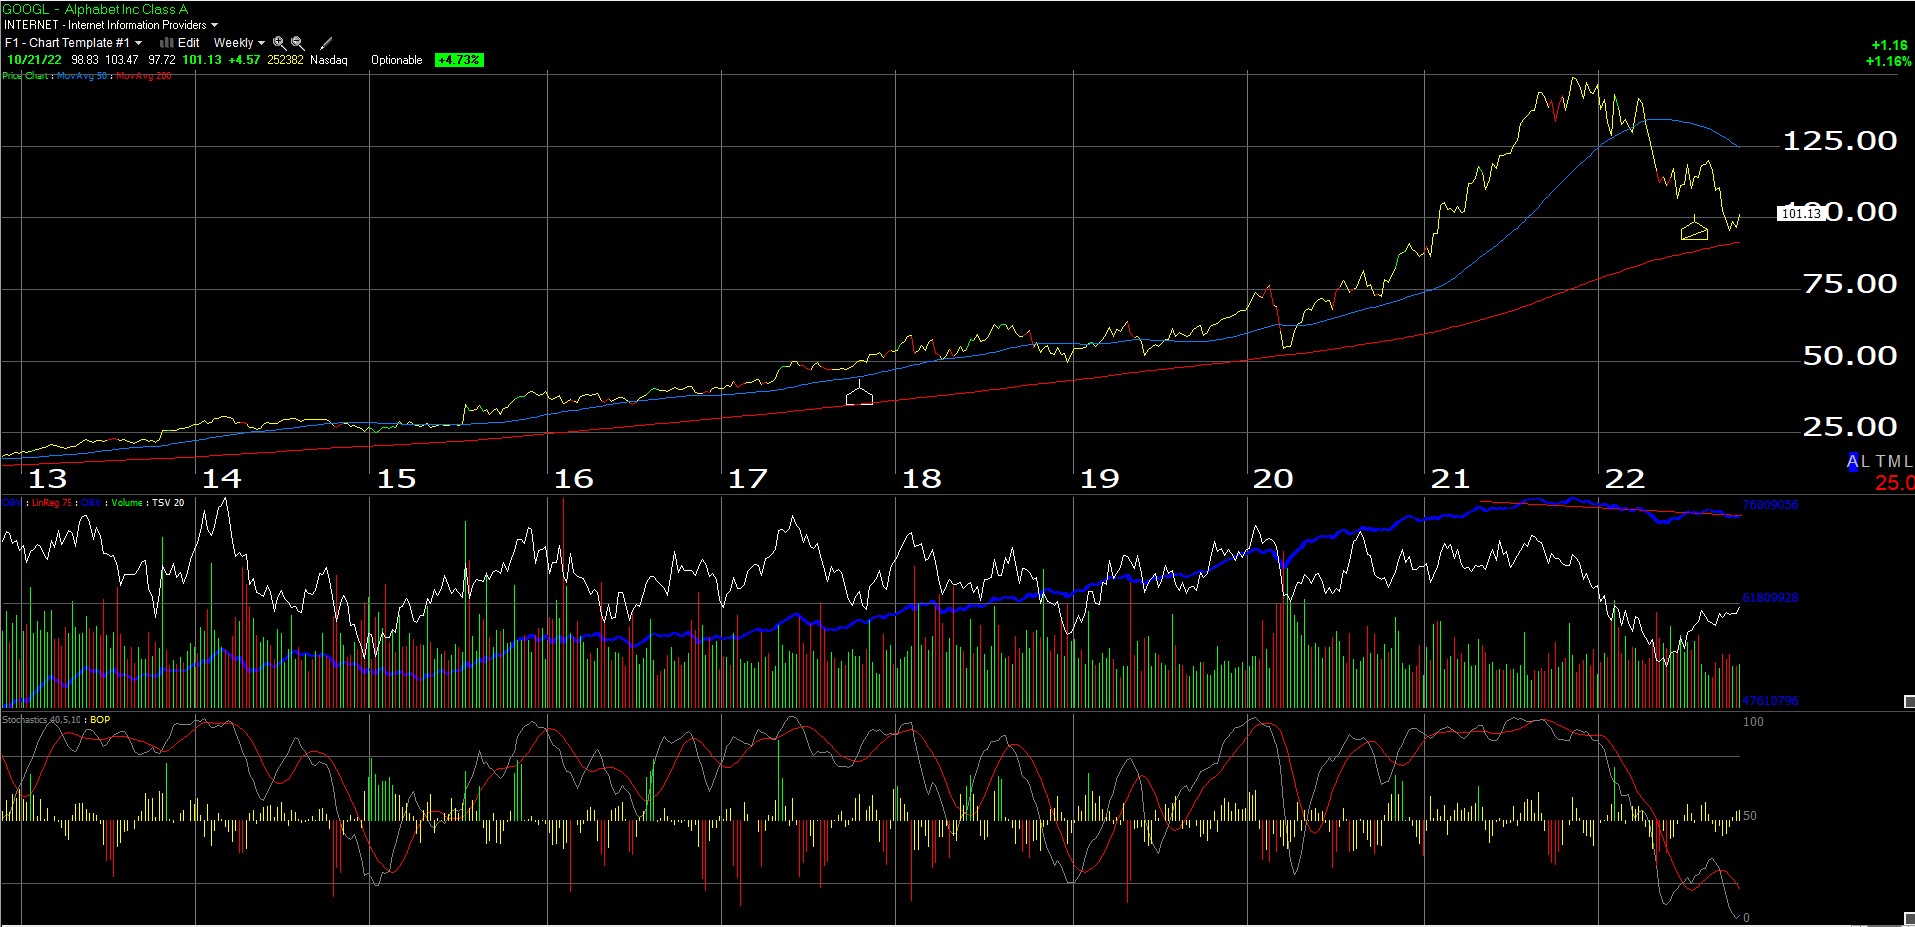
Summary: GOOGL grew revenue and EPS 42% and 91% in 2021 and is on track to grow revenue 11% on -9% EPS drop for ’22, so the worries and angst over the US economy and a potential slowdown may just be the “normalization” of growth rates in the post-Covid-19 world. The multiple of 20x ’22’s estimate isn’t unreasonable for the search giant that should grow 10% – 15% annually, even in a tough economy.
Google Cloud is just 9% of GOOGL revenue as of the June ’22 quarter but grew 36% y.y in June ’22, vs advertising’s +12% y.y growth. Given GOOGL’s dominance in search, I have thought of GOOGL’s cloud’s ultimate impact on AWS and Azure (i.e. Microsoft). GOOGL advertising has slowed but really only from ’21’s torrid pace of growth.
Morningstar’s projected “fair value” on GOOGL is $169 per share leaving the stock at it’s current price at a 40% discount to perceived intrinsic value. What bothers me is the negative revision trend in EPS. It’s easier to be a buyer of GOOGL at these levels if those EPS revision trends would turn positive.
Microsoft: (MSFT): reports Tuesday, 10/25/22 after the close
MSFT reports their first fiscal quarter of 2023 on Tuesday night with Street consensus expecting $2.30 in EPS on $49.6 billion in revenue for expected y.y growth of 1% in EPS and 9% revenue growth. A 9% y.y revenue growth quarter for MSFT would be the weakest y.y growth since the June ’17’s growth of 9% as well.
For full-year fiscal 2023, the software giant is still expecting 9% EPS growth on 10% revenue growth.
EPS revisions:
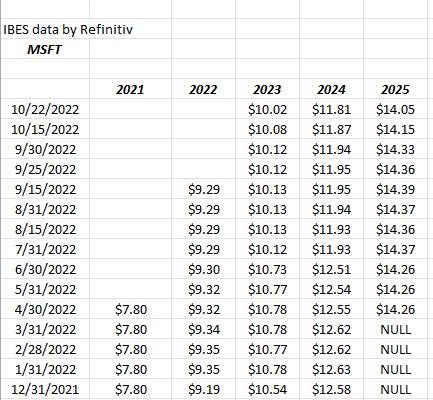
Revenue revisions:
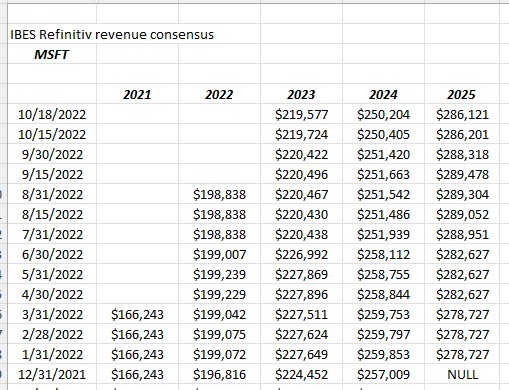
For fiscal ’23 (ends June ’23) MSFT’s consensus EPS estimate has slid 5% and ’24’s is down 7% since 12/31/21. The consensus revenue estimate has been revised lower for fiscal ’23 by 2% and ’24 by 3% since 12/31/21 so not too bad, but still negative.
In fiscal Q4 ’22, which ended June ’22, MSFT guided to double-digit EPS growth for ’23 on a flat operating margin, but with recent headlines (and take some of that with a grain of salt) MSFT did announce layoffs which is never inspiring in front of a quarterly earnings.
For me personally, MSFT is still all about Azure and the cloud segment. Intelligent Cloud is 40% of MSFT’s revenue as of June ’22 and 42% of MSFT’s operating income. In Q4 ’22 Azure grew 46% y/y, still very, very healthy but it’s been slowing about 1% a quarter.
The dollar strength is a decided negative for MSFT in Q1 ’23. Also expect the More Personal Computing segment (28% of rev, 22% of op inc) to be slower after the June quarter showed 2% revenue growth and a -5% operating income growth y.y.
The chart:
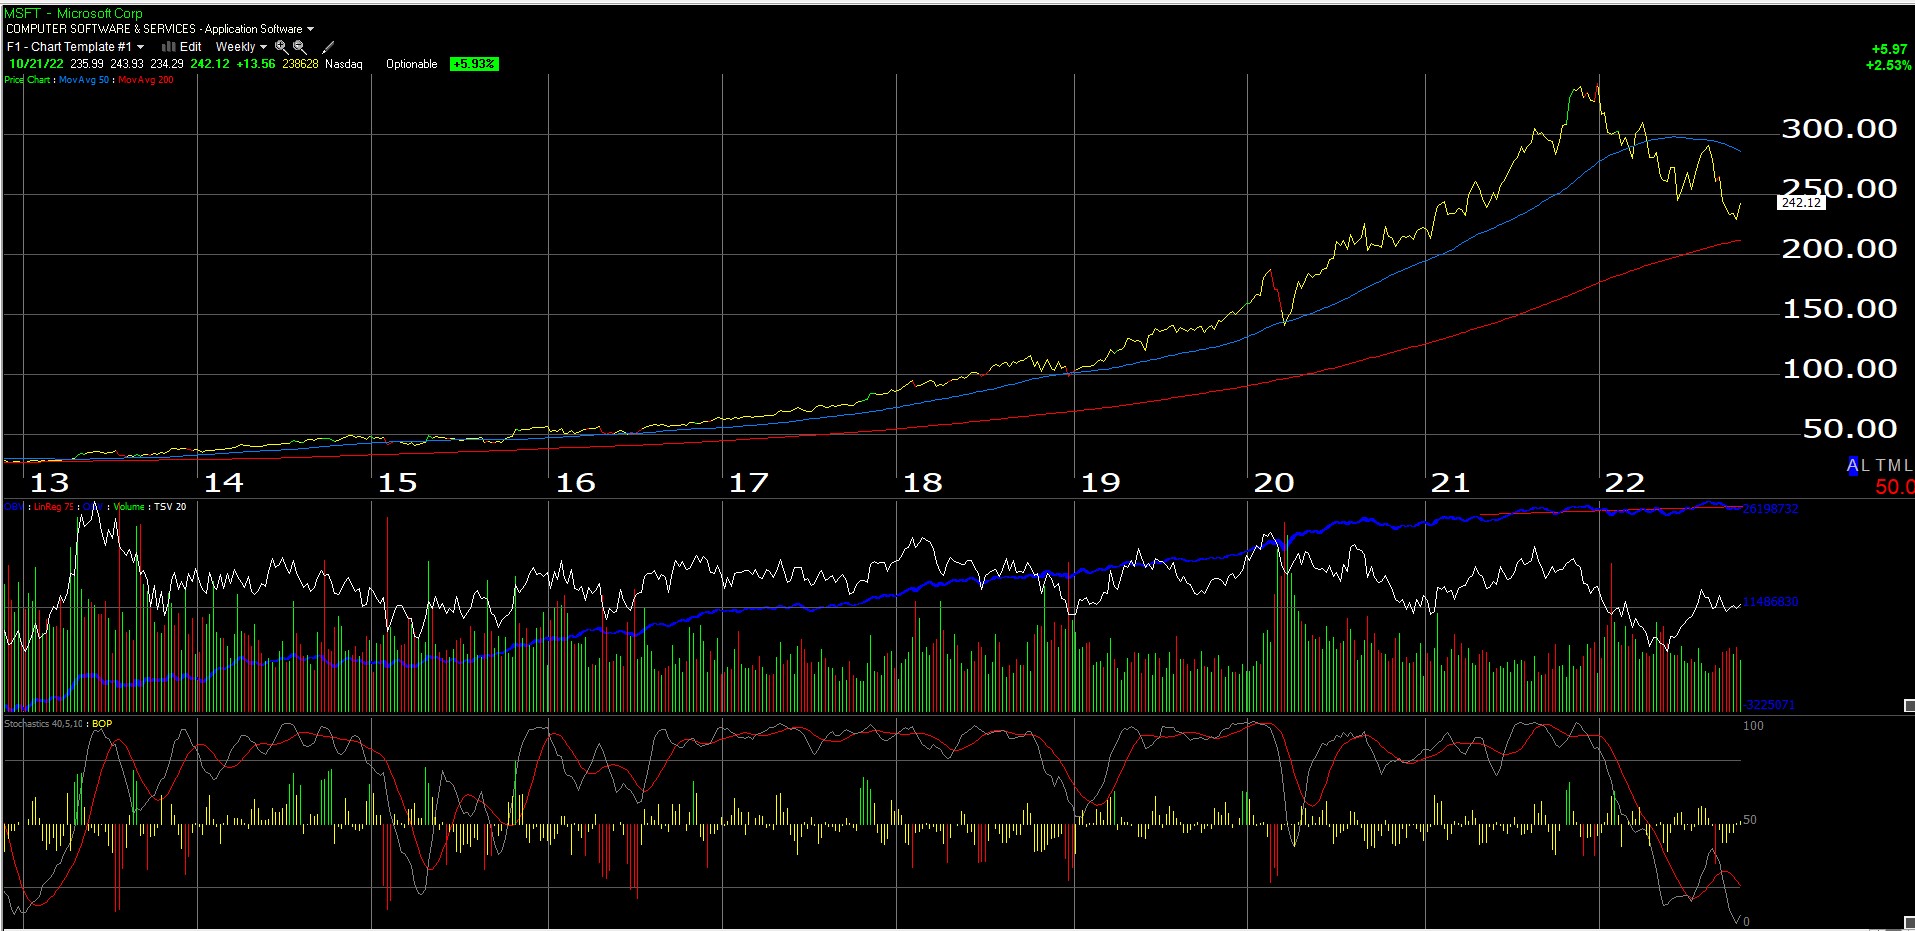
Valuation: Trading at 20x the expected fiscal ’23 EPS estimate of $10.02 with 9% EPS growth expected this coming year, puts Mr. Softee at the higher end of its PE to growth valuation, but with $105 billion in cash still on the balance sheet, perhaps MSFT bought up more shares with the stock down from $350 in late ’21 to $242 as of Friday night’s close. At 19x and 26x cash-flow and free-cash-flow with a 3% free-cash-flow yield, MSFT never really looks cheap, so readers need to assume that it’s unlikely they will ever see the giant at a 10x PE.
Morningstar’s fair value for MSFT is $352, which leaves MSFT trading at a 32% discount to perceived intrinsic value as of Friday night’s close, while the internal model is closer to $300 in fair value for MSFT, with an edge towards considering negative revenue and EPS revision trends.
Summary: While MSFT’s weekly chart looks a lot like GOOGL’s, their financial results also resemble each other since MSFT like GOOGL saw a burst of growth during 2020 and 2021, even in the Personal Computing business and now that has started to settle back down. MSFT’s “peak covid-19” quarter was actually Sept of ’21, which the company is lapping with this release where MSFT grew revenue 21%, operating income +27% and EPS +23%. June and September of 2021 are tough compares for Microsoft, so consider this when thinking about Tuesday’s night’s coming report.
Again, MSFT’s forward expected return depends a lot today on Azure and the cloud and Azure’s #2 position relative to AWS. There seems to be no reason to think that growth is impaired although given MSFT and AMZN report this week, we get a fresh look at the cloud operations of the #1 and #2 market-share leaders.
META: reports Wednesday, 10/26 after the market close
When META reports Wednesday night after the close, the Street is expecting $1.89 in EPS on $27.4 bl in revenue for expected y.y growth of -41% and -6% respectively.
After EPS and revenue rose 37% and 40% respectively in 2021, META’s growth this year has slowed appreciably and 2022’s expected growth for EPS and revenue is -29% and -1% respectively.
-1% expected revenue growth for 2022 – that’s not good, especially considering META has averaged 42% revenue growth per year since coming public in 2013.
Ugly…
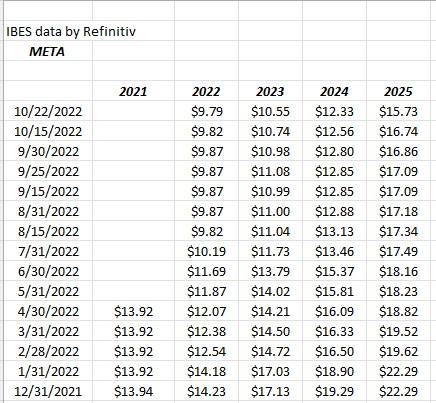
EPS revisions:
Revenue revisions:
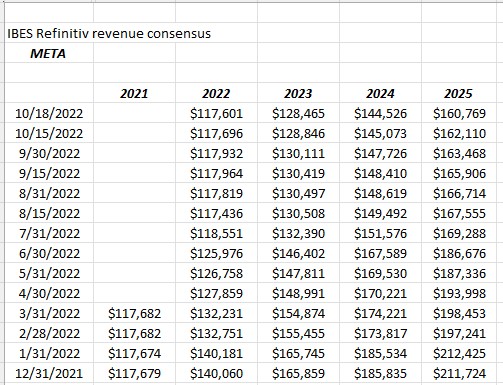
There is nothing real positive about EPS or revenue revisions for META: 2022 and 2023 EPS revisions are down 32% and 33% respectively since 12/31/21. Probably more importantly the 2022 and 2023 revenue revisions are down 17% and 23% respectively from 12/31/21.
2023 EPS and revenue estimates are looking for 9% and 8% revenue and EPS growth respectively for next year, but that’s a stretch right now.
Valuation: META is trading at 13x and 12x 2022 and 2023 EPS estimates of $9.79 and $10.55, 5x and 9x cash-flow and free-cash-flow (ex-cash) and sports a 10% free-cash-flow yield at $130 per share.
It’s interesting that Morningstar still has a fair value price on META of $346 per share, meaning META is trading at a 62% discount to Mstar’s fair value estimate. What worries me is the continued sharp cuts to the forward EPS and revenue estimates. Negative revisions are taking it’s toll. (The one stat that jumps out at you about META is that it still has 3 bl MAU’s or monthly active users.)
Summary: Cash and marketable securities are 11% of META’s market cap at $130 per share, so Mark Zuckerberg has plenty of cash available and since June of 2020, META has generated $67 billion in free-cash-flow of which $64 billion has been returned to shareholders via stock repurchases since June of 2020.
Readers don’t have to try and bottom fish META. There’s a lot of unknowns around the stock right now and little sign the Metaverse is gaining any traction commercially at all. It’s tough to bet against Zuckerberg though. The majority of FB / META was sold in 2017 with the Cambridge Analytica mess. I felt like Mark lied to shareholders about what they were doing with client data. Larry Ellison – early in his career – did that too. Hopefully Mark doesn’t repeat his mistakes.
The negative EPS and revenue revision trends speak for themselves. A small position is held personally and clients that saw FB bought under $20 per share in 2013 still hold some stock, but the vast majority was sold in 2017.
Apple: reports Thursday, October 27th, 2022 after the close:
The Street is expecting $1.27 on $88.9 billion in revenue for expected y.y growth of 2% and 5% respectively. The juggernaut that has long been Apple is really all about the new iPhone for this quarter and more importantly what the guidance might look like for the all important fiscal Q1 ’23 or the holiday quarter.
Currently the Street is expecting $2.14 and $128.3 billion in revenue for the December ’22 quarter or 2% expected EPS growth on 4% revenue growth.
What’s interesting is that the last time Apple saw a y.y decline in revenue growth in the critical holiday 4th quarter was December, ’18, when Apple revenue fell 5% y.y, which was the last time the Fed was raising interest rates and slowing the US economy. Is Apple now a consumer cyclical or consumer discretionary, rather than a “tech” stock ?
EPS trend
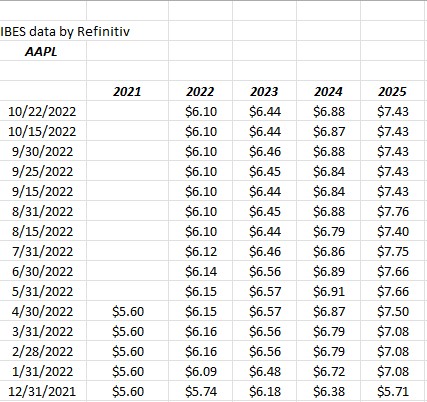
Revenue trend
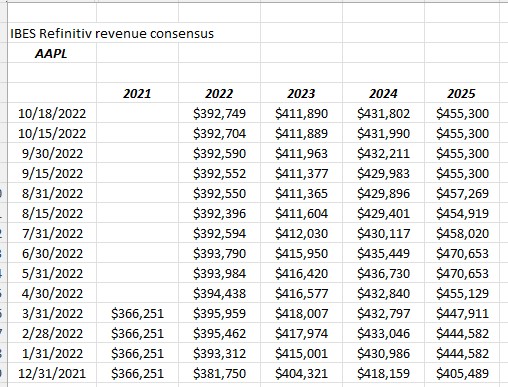
Unlike the other tech companies, AAPL’s EPS and revenue revisions are firmly positive for 2022 albeit they moved up less robustly after the holiday quarter of 2021.
This is a plus for the iPhone giant, for sure.
Valuation: Apple’s PE is 24x and 23x the 2022 and 2023 EPS estimates which are expecting 7% and 6% EPS growth respectively so the stock is stretched in terms of it’s PE to growth. Trading at 19x and 21x cash-flow and free-cash-flow the cash-flow valuation is also expensive although at $147 per share, the free-cash-flow yield is 5%, which is still bond-like for Apple.
There’s two metrics worth watching: the iPhone is still roughly 50% of Apple’s total revenue and “ASP” or average selling price has seemed to stay constant in the $800 – $850 range over time. The basic economic equation is “P*Q” or price times quantity and I wonder as the iPhone reaches – what – 13 years of age, whether Apple can push price increases even with lower unit sales. The new iPhone was panned, while the Max and the Max Pro seem to be better received this year, but it really all depends on what the holiday season holds.
It’s interesting to me that Morningstar still carries a “narrow moat” on Apple, which is surprising given it’s one of the world’s great brands, but that topic deserves a longer article, since I suspect I know why Mstar still carries a narrow moat on the giant.
Summary: Given the EPS and revenue revision trends Apple will head into fiscal Q4 ’22 financial results in good shape. It’s the only “tech” company of the 5 that has positive EPS and revenue revisions. The ubiquitous “supply constraints” showed up in Q3 ’22 again and according to Morningstar are expected to get easier in Q4 ’22 and fiscal Q1 ’23. Apple typically introduces a new iPhone every 8 quarters so the holiday season for ’22 will be critical since the iPhone will be hot (so to speak).
Amazon: reports Thursday, October 27th, after the close
To say that Amazon hit a wall in mid-2021 would be a vast understatement as the ecommerce juggernaut has seen slowing growth in the last 15 months. Here’s a snapshot of revenue estimate trends for AMZN that shows readers the slowing that has occurred:
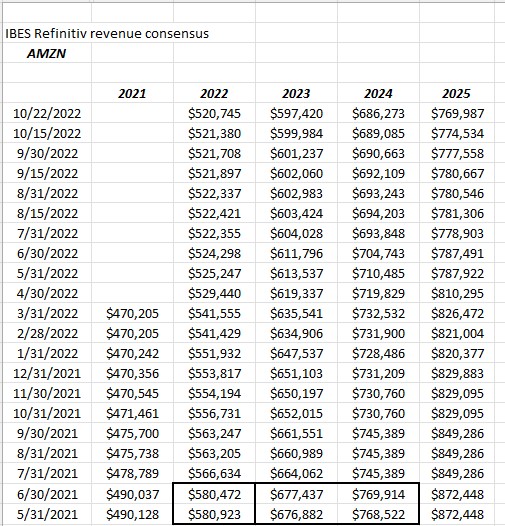
The bordered lines are the peak revenue estimates for Amazon in the last 15 months. 2022’s revenue estimate has slowed 10% since the summer of 2021 while 2022’s estimate has been revised lower by 12%.
The one stat I like to throw out to readers is that – since 2003 through 2021 – Amazon had one year of revenue growth slower than 20% and that was 19% in 2014. From 2003 through 2021, Amazon’s revenue growth averaged 29%. In 2022, Amazon is expected to grow total revenue just 11%.
Part of the problem is the 38% and 22% revenue growth in 2020 and 2021 as America was forced to lock down in the home, not to mention labor shortages, higher transportation costs, a glut of overcapacity in the warehouse square footage, and perhaps the re-opening of America after Covid, and a desire to shop in traditional brick-and-mortar.
In Q2 ’22, ecommerce revenue actually fell 4% y.y (a tough compare) and has declined y.y for three consecutive quarters, even though physical store rev rose 12% but that segment is still a small part of total revenue. AWS grew revenue 33% and operating profit 36% y.y, badly needed given the slump in ecommerce and AWS basically was responsible for all of Amazon’s operating profit.
AWS has risen to 16% of AMZN’s total revenue as of June ’22, up from 10% in 2019.
Valuation: Since Amazon is only expected to earn $0.10 in 2022 the PE is relatively worthless but 2023 for AMZN is expecting $2.44 per share. The write-down on Rivian and the overcapacity in warehouses has crushed EPS and free-cash-flow. AMZN has cumulatively lost $61 billion in free-cash-flow in the last 4 quarters with the June ’22 quarter being the worst.
Morningstar’s fair value estimate on Amazon is $192 per share, leaving AMZN trading today at a 42% discount to perceived intrinsic value.
The valuation bottom-line is that AMZN’s valuation is very distorted still after Covid-19. “Normalized” EPS for Amazon in a steady state world is probably between $4 -$5 per share over time, which leaves the multiple today around 20x – 25x for what should be a 10% – 15% EPS and revenue grower over time.
Summary: It a little nervous to see so many bulls around Amazon today after the year it’s had, but Amazon under Jeff Bezos was one of the most disruptive and transformative companies in America in the last 20 years. Maybe – just maybe – it’s maturing into a slower growing cash-cow. Like Microsoft’s Azure, AWS is the hidden gem within Amazon and it seems to have plenty of growth left within the cloud space, with the #1 market-share position.
Amazon is another victim of the “Covid-19 compare” and 2022 versus 2021 is looking quite ugly, but i’d suspect the ecommerce revenue will start to turn positive again in Q4 ’22 and then remain so into 2023.
The hidden story within Amazon is that they may never see that incredible string of revenue growth like that again.
Broader summary of the 5 stocks expected to report this week:
Ranking FCF yield best to worst:
- META: 10%
- Apple: 5%
- GOOGL: 5%
- MSFT: 3%
- AMZN: 0%
Ranking “discount to perceived intrinsic value”
- META: -62%
- AMZN: -42%
- GOOGL: -40%
- MSFT: -32%
- AAPL: 0% (slightly overvalued)
Ranking Expected ’22 – ’23 PE highest to lowest:
- AMZN: 500x – 41x expected ’22 and ’23
- MSFT: 24x – 20x
- AAPL: 24x – 23x
- GOOGL: 20x – 17x
- META: 13x – 12x
Business Model – Narrowest to Widest or most at Risk of Disruption:
- META: given it’s tectonic shift from Facebook, which has (had) no competition, to the Metaverse;
- MSFT: heavy reliant on Azure’s (and cloud) growth. Went 16 years w/out making new high from 2000 to 2016;
- GOOGL: search is still king but GOOGL cloud and YouTube trying to get meaningful;
- AAPL: Apple resembles a consumer staple of consumer discretionary. It will be interesting to see how iPhone demand holds up in a recession.
- AMZN: broad acceptance of e-commerce platform will never be replaced.
(Those perceived “moats” definitely differ from Morningstar moats so take those rankings with a grain of salt. It’s my perception of the moat and “tech history”.)
Clients are long all of these names with Microsoft being the largest position, and Apple and META being the smallest. A lot of Apple was sold in 2017 during the then President Trump’s China tariffs, which caused free-cash-flow to fall below net income. My mistake was Apple has operated flawlessly since the early 2000’s managing each iPhone launch without a glitch. Apple’s execution has really been remarkable. GOOGL and AMZN are the two stocks today that are probably too depressed in terms of their long-term valuation. META was sold in 2017 – 2018 with the Cambridge Analytica mess. (These Top 10 positions haven’t really changed substantially since the this was published on July 31 ’22.)
Take all this with substantial skepticism and a healthy grain of salt. Past performance is no guarantee of future results. Opinions and capital markets can change quickly and this blog may not be updated. Trading is very different than investing and this blog tends to be longer-term oriented.
Thanks for reading.