Charles Schwab (SCHW): Scheduled to report Monday, October 17th before the opening bell
Chuck has been a relative strength star in 2022 avoiding a lot of the deep pain we’ve seen in financials, particularly the larger banks and investment banks. The stocks has fallen from the $90’s to the low $70’s and is down just 14% YTD.
When Schwab reports next Monday, consensus sell-side expectations are expecting $1.05 in EPS on $5.4 billion in revenue for expected y.y growth of 25% and 18%.
That’s good growth for a financial for 2022, primarily since SCHW is a beneficiary of rising interest rates (net interest income) and has no capital market or investment banking activity (or proprietary trading) to speak of to drag down results.
In the 2nd quarter, 2022, operating income or pre-tax income was $61 million ahead of expectations and the pre-tax operating margin was 49.5%.
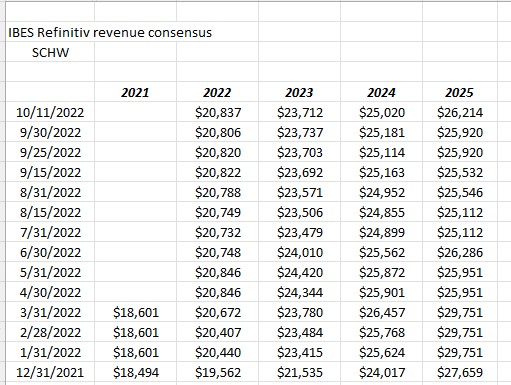
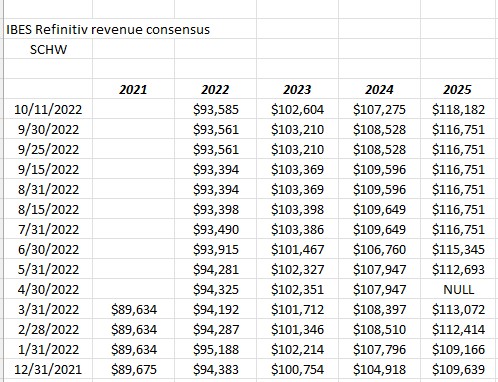
The real story to Schwab is that – using the 3-year average EPS and revenue growth – Schwab is expected to generate 17% EPS growth and 11% revenue growth (average) over the next 3 years.
Here’s the consensus EPS and revenue trends to support that growth:
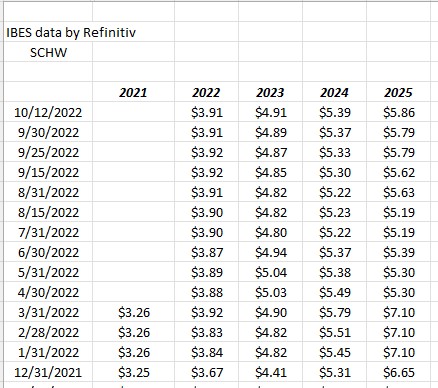
Note with Schwab’s EPS trends, there aren’t a lot of SP 500 companies that are generating consistently higher EPS revisions in 2022, given the capital markets and the asset management trends.
Schwab is trading at 18x expected EPS for average EPS growth over the next 3 years of 19%. Schwab’s PE has actually compressed below it’s “expected” growth rate.
The TD Ameritrade merger has helped tremendously. Schwab is still a Top-10 holding in clients accounts.
Could the analyst’s be wrong ? Sure. Wait until Schwab reports if you like the metrics and EPS trend. Watch the pretax operating margin and the NIM (net interest margin) next Monday morning.
Blackrock (BLK) reports Thursday morning, October 13th before the opening bell.
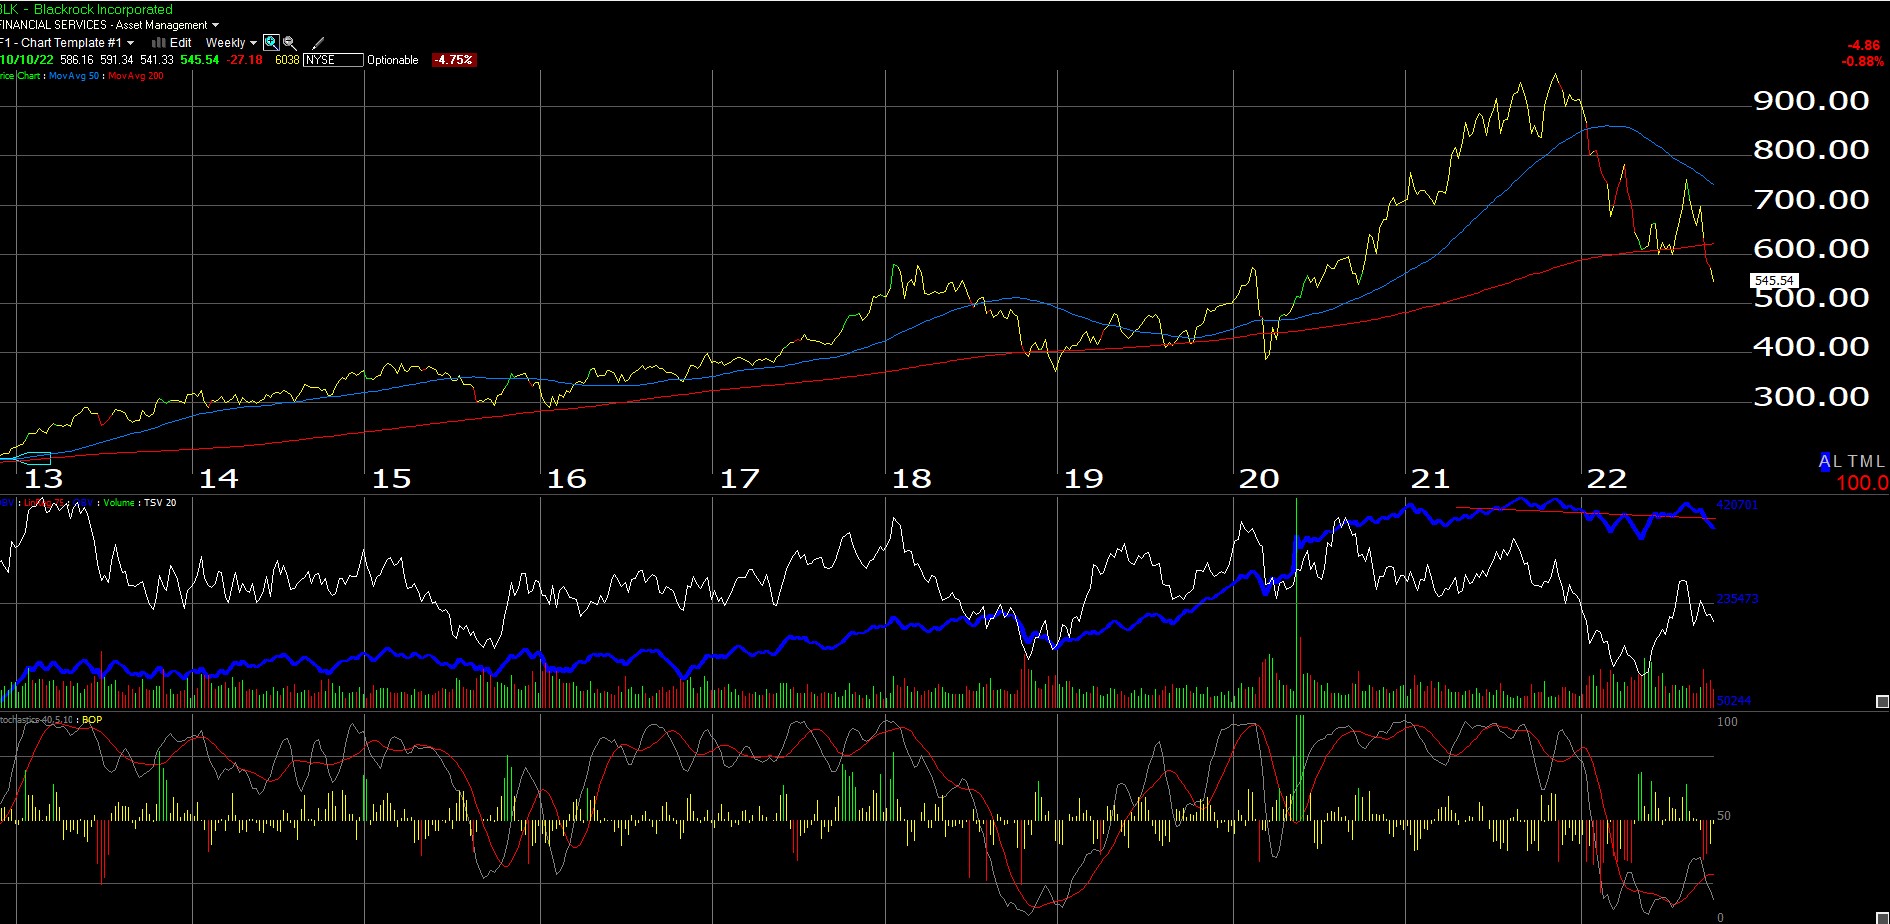
It’s rarely done but the stock has never been owned for clients, however it’s worth a few minutes to post the chart and give the fundamentals a look and see what’s new with Blackrock, given they are in the news regarding ESG, etc.
When Blackrock reports on Thursday morning before the opening bell, consensus is expect $7.14 in EPS on $4.1 billion in revenue for an expected year-over-year (y.y) decline in EPS of 33% and a decline in revenue of 29%.
Being the world’s largest asset manager (or close to it), Blackrock’s stock price decline of -40% as of Monday night’s close, is commensurate with the -23% decline in the SPY YTD as well as the -15% decline in the AGG.
Trend in EPS and revenue estimates for BLK:
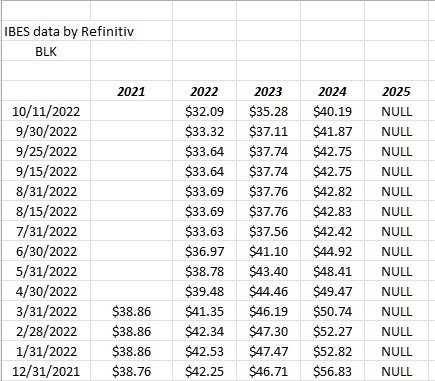
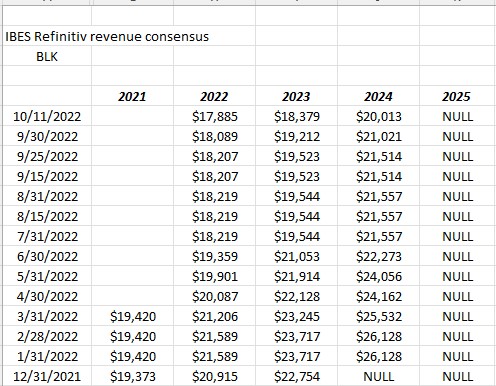
In the last year the 2022 EPS estimate for BLK has declined about 25%, while 2023’s erosion has been a little more restrained.
Summary: Having never owned or modeled the stock, I don’t want to venture out too far on the opinion spectrum but at $545 – $550 per share, BLK is trading at 17x 2022 EPS for expected 9% growth in 2023. Using the Morningstar valuation metrics, BLK’s ROE is 15% – 16% and it’s fair value rating is $850 or 56% higher than today’s price. Whether to own it or not is probably contingent upon what you think will happen with the market both here in 2022 or more importantly 2023. The ESG headlines or controversy is more a distraction than anything although I was always puzzled why CEO Larry Fink became such a public proponent of the climate change discussion. He is certainly entitled to his opinion as an American, but why drag Blackrock (the company) into that mess ? You can tell the US economy has a 3.5% unemployment rate when this blog can’t be covered by a BLK wholesaler even though Rick Rieder’s Blackrock Strategic Income Opportunity Fund (BASIX) is one of client’s top 2 positions.
Goldman Sachs (GS): Goldman Sachs is scheduled to report Tuesday, October 18th, before the opening bell.
Goldman is currently trading right on top of book value at $300 per share, even though EPs is expected to decline 42% to $34.17 per share after the banking giant printed $60 in trailing 4-quarter EPS in September and December ’21. Goldman officially printed $59.36 in EPS for 2021, rising 91% y.y.
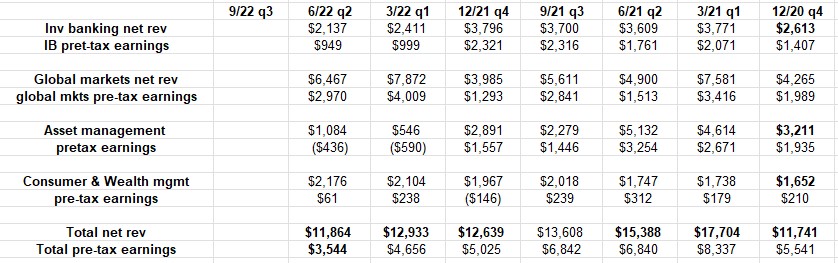
This Goldman breakdown by business line shows that while net revenue as of the June ’22 quarter is now back to the same level as December ’20, pre-tax earnings are now lower (bottom 2 lines). The stock was at $200 in December ’20 versus trading around $300 today.
Goldman isn’t a tough bank to analyze: Investment banking and Global Markets are 75% of net revenue and all of pre-tax earnings as the asset management has been unprofitable this year, so if the capital markets are in tough shape as is the case in ’22, EPS and net revenue will decline as they have in ’22.
Goldman’s EPS peaked at $60 per share in 2021 thus it may take years to exceed that number given the pandemic’s monetary stimulus. Goldman’s stock peaked at $425 in November ’21 and has traded down to $300 at current levels.
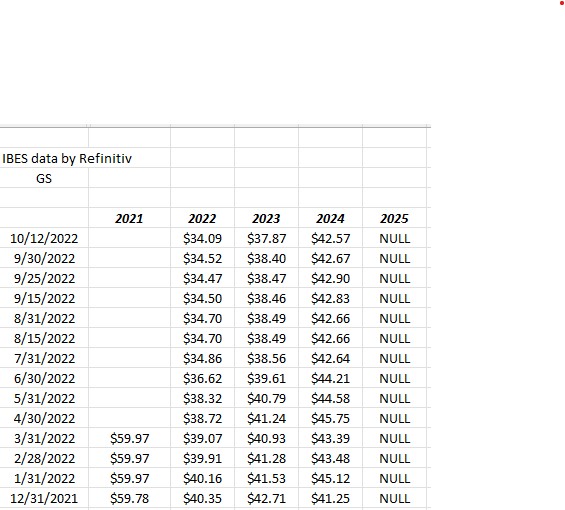
EPS estimates for 2022 and 2023 have been revised lower by 15% and 11% respectively since 12/31/21.
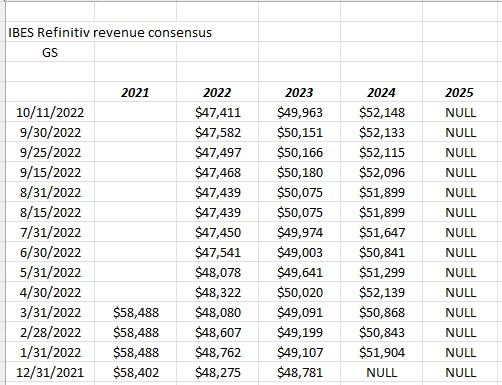
Revenue revisions have been more stable over the last 10 months.
Buying the stock under book value will eventually pay off. Looking at pre-Covid (2019 and before), GS would trade as high as 1.3x – 1.4x book value before retreating.
Technicians might say the stock has good support around $250 – $260. $280 was the 2018 high before it corrected in that year, and 200-week moving average is also around $260.
Goldman is a very small position at present, but the further it falls under $300 that could change.
Bank of America: (BAC):
Bank of America is also scheduled to report Monday morning, October 17th, before the opening bell.
Street consensus is looking for $0.77 in EPS on $25.6 billion in revenue for expected y.y growth of -9% and +4% respectively. In Q2 ’22 EPS fell 29% and revenue rose 6% y.y.
Like a lot of banks, net interest income (NII) was actually above expectations but fees were lower (mortgage banking, asset management, etc.)
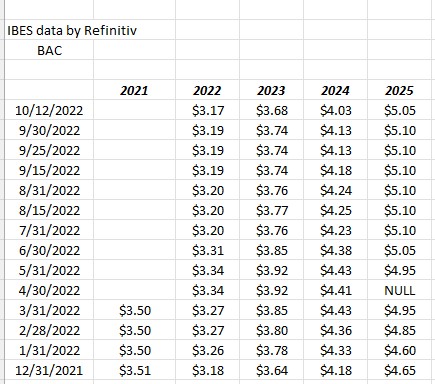
EPS negative revisions aren’t terrible but note revenue revision trends for 2023. The current 2023 revenue estimate is higher than 12/31/2021.
Bank of America is also not a very big position.
Summary / conclusion: Combining this summary with the earlier preview of financials scheduled to report Friday, October 14th, readers don’t need to own anything until this market settles down and readers get comfortable with the Fed being closer to an end of the fed funds rate hikes, so tread cautiously.
Here’s the YTD returns of all the financials previewed:
- JP Morgan: -33%
- Morgan Stanley: -19%
- Citigroup: -30%
- Wells Fargo: -14.5%
- Charles Schwab: -14%
- Blackrock: -40%
- Goldman Sachs: -21%
- Bank of America: -31%
- SPY: -23.8%
- (Source: Morningstar data as of 10/11/22)
The problem with a market like this and a Fed like today’s Fed, is that the banks and financials can post good results for Q3 ’22 earnings reports and the stocks continue to scrape multi-year lows as they await the Fed to change course and the true recession depth can be determined (to the extent that can be done).
JP Morgan is still a top 10 holding and with Jamie Dimon talking about “economic hurricanes” and “big problems” in 2023, while Morgan Stanley’s CEO James Gorman says the economy and the client base look ok from where he is seated, you have to wonder about the divergent views from two very competent CEO’s.
I always tell clients that credit spreads are typically an early-warning indicator of recession depth, and high-yield credit spreads even more so, but even the “duration” in high-yield and high-grade corporate asset classes has caused both groups to trade lower this year despite what has been a relatively benign credit environment.
The expectation about Q3 ’22 financial results for the majority of financials should be positive but expect bank management’s to guide cautiously and play down any good results. And readers really can wait to see what the actual results look like before stepping in to stocks.
CPI tomorrow (i.e Thursday morning, October 13th before the open) should push the market around again, one way or the other. For readers it’s all about position size and time horizon if you want to commit capital before an earnings deluge.
For the last 2 quarters, Q1 ’22 and Q2 ’22 (particularly with the compares against 2021), the Street cacophony was that SP 500 earnings were “on the verge of collapse” – it’s been going on now for 9 months. Net interest income is strong, some of the cyclical businesses are weak, credit still seems healthy and the financial sector will increase loan loss reserves, but financials – in my opinion – remain fundamentally healthy in their present state.
Guidance for Q4 ’22 and the first look for ’23 will be anything but robust so consider all this when contemplating positions.
Take everything here with a healthy skepticism. EPS and revenue estimates are courtesy of IBES data by Refinitiv, while econ data is courtesy of Briefing.com. Past performance is no guarantee of future results and all opinions are my own. There is no recommendation to buy or sell anything, but qualitative opinions are given on individual securities. Capital markets can change quickly both positively and negatively. This year could still get worse in terms of market returns.
Thanks for reading.