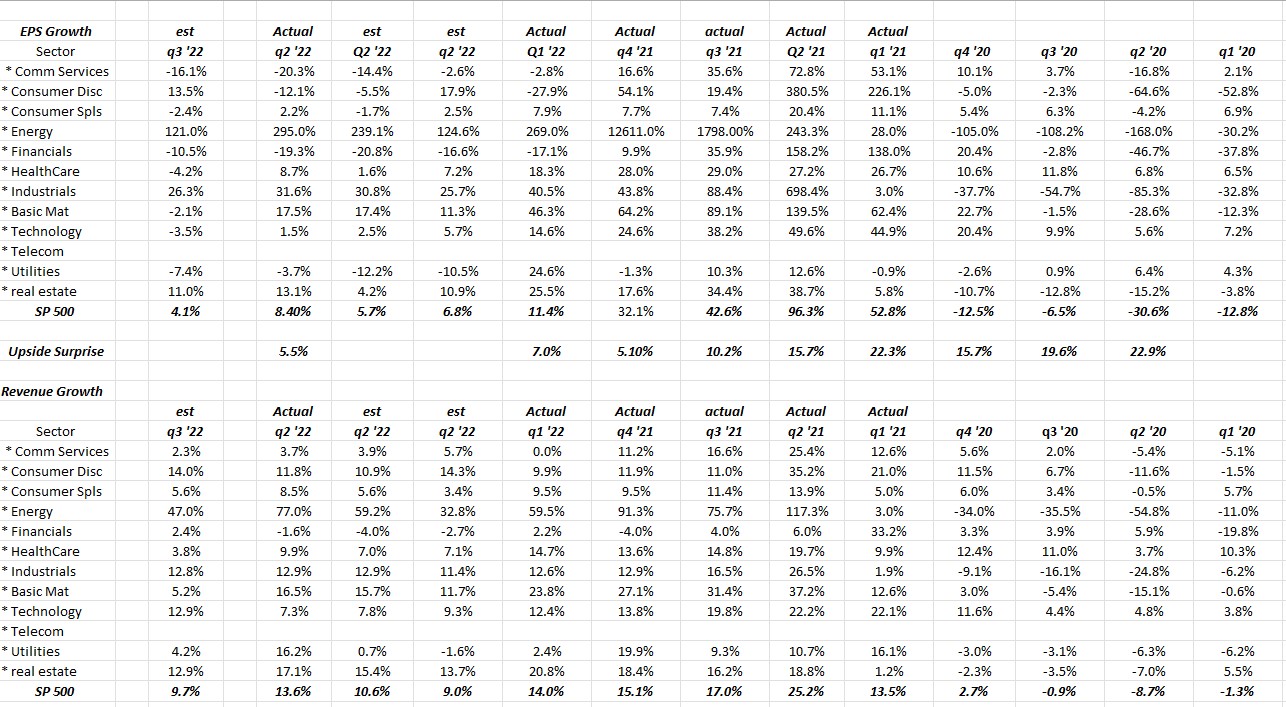
The above table shows the actual history of revenue and EPS growth by sector for the 11 sectors of the SP 500, dating back to the beginning of Covid-19 in Q1 ’20.
One thing that struck me was that – if I were living on the hypothetical desert island – and didn’t know the Fed was raising rates, you could plausibly make the case that 2022’s earnings and revenue progression by quarter was simply a natural “mean reversion” to the monetary-steroid driven results of late 2020 and through the 4 quarters of 2021.
First though, with all the energy sector bulls out there, let’s take a look at the revenue and EPS compares for the energy sector starting with Q3 ’22 and moving forward.
We won’t get the bulk of energy results until later in October. Note energy EPS growth in Q3 ’21 of 1198% and the actual revenue growth of 75.7%. In Q4 ’21 energy revenue actually grew 91% y.y with the point being that the sector has very tough compares from Q3 ’22 through the middle of 2023.
The technicians are bullish energy and for good reason as names like Exxon (XOM), Chevron (CVX) and Schlumberger Ltd (SLB) are all good looking charts, still trading above their 50 and 200-day moving averages.
The goal regarding energy is not to persuade or dissuade one way or the other. Just note that the next 4 quarters – Q3, ’22 through Q2, ’23 – are tough compares by the numbers.
In columns that are bordered in some areas, that’s the trend in Q2 ’22 EPS and revenue by sector. Here’s some conclusions:
- Technology looks awful with EPS starting the quarter expecting MSD growth and revenue starting Q2 ’22 high-single-digit growth and both EPS and revenue faded by the end of the 2nd quarter to actual lower numbers. Now the compare against Q2 ’21 was monstrous – 22% revenue growth and 49.6% EPS growth for tech in Q2 ’21 – and those compares ease as we move into late 2022 and 2023. The semiconductor warnings aren’t good – they are often the canary in the coal mine – and semi’s correlation to the overall health of the stock market has been duly noted by Bespoke over the last several years.
- 56% of Technology revenue is non-US and thus sensitive to the US dollar strength. Here is last night’s post showing the percentage of foreign sales for each of the 11 SP 500 sectors (see bottom of blog).
- HealthCare, Industrials and Basic Materials all finished the quarter with stronger EPS growth than was started Q2 ’22. That’s a good sign. Utilities and Real Estate too.
The goal of showing this data was to give readers an idea of the trend in Q2 ’22 earnings last quarter and which sectors were showing stronger EPS growth and which were showing weaker EPS growth over the 90 days.
Finally the first data column is showing what’s expected for Q3 ’22 EPS and revenue growth by sector. Those numbers will be updated around November 1. Expected revenue and EPS growth for the SP 500 is lower than Q2 ’22 and EPS is expected to be half of Q2 ’22’s 8% starting at 4%. That will likely be a little higher by the end of December ’22 but note the “upside surprise” factor (in the middle of EPS and revenue columns) which is slowly fading. The fact is Q2 ’22’s “upside surprise” of 5.5% is actually higher than the long-term average of 3% to 5%.
Summary / conclusion: The point of all this is to show readers that what may turn out to be an “average” quarter of EPS and revenue growth for the SP 500 is going to look recession-like because the compares are so tough against 2021. And I’m not trying to create a bullish case, either.
One thing that impressed me during the pandemic was how bad the analysts were at forecasting results. Just look at the upside surprises generated from Q2 ’20 through Q2 ’21. Is that all monetary-policy driven ? Maybe, will the tightening that began in 2022, will that drive the opposite results ? It certainly could.
Keep an eye on high-yield ETF’s like HYG and HYS (PIMCO ETF) and JNK. The charts haven’t broken below their June ’22 lows but are hovering in the area.
Thursday and Friday start the Q3 ’22 earnings off – mainly financials.
None of this is a recommendation to buy sell or hold anything unless specifically stated. Past performance is no guarantee of future results. All the earnings and revenue data is courtesy of IBES data by Refinitiv. Conditions can change quickly in capital markets, both positively and negatively.
Thanks for reading.