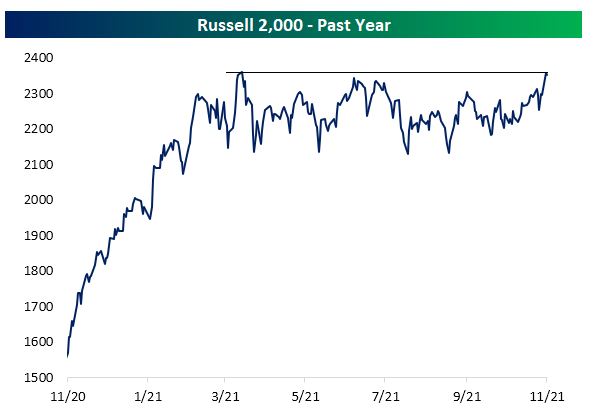
There are a lot of these charts floating around of the possible pending breakout of the Russell 2000 above the March ’21 highs, but bespoke published this late today, and also noted that the R2k is trading 2.99 standard deviations above it’s 50-day moving average, which is pretty extended. But looking at this historical pattern, the 3 and 6-month historical returns are pretty healthy, even when the index is this extended. Clients happen to be long the XBI and the IWM and one of Schwab’s small-cap index fund, but it’s not a big position. Those readers who like to trade keep an eye on the $234 – $235 level and wait for the breakout. For what it’s worth, the XBI or biotech ETF (and there are a couple of them like the IBB), tends to correlate pretty well with the Russell 2000.
I cant help but notice the explosion in electric vehicle (EV) interest versus the rising price of gasoline. That relationship will have to end eventually. Back in 2013 – 2014, there was an article from the IEA (Int’l Energy Agency) or some such think tank that noted that 50% of the crude oil demand in the US is driven by gasoline distillation, which promptly led me to sell what little energy stocks that were owned for clients and kept me out of the sector to this day. Each day, more and more Tesla’s are seen on the road. Although the rig count expansion (i..e supply) seems much more constrained in this crude oil bull market, it seems completely incongruous that the pending explosion in electric vehicles on the road and rising crude oil and gasoline is sustainable together. Something has to give…
The last “tapering” in 2013 by Ben Bernanke actually coincided with a record year for the stock market, a year where the SP 500 returned roughly 35%. For readers that are looking for a similar stock market reaction to Powell’s expected tapering, don’t expect a similar outcome at least in stock price returns. In 2021, we (as in readers and I) are 13 years into the secular bull market that began in March, 2009, or 8 years in if you wish to use the late April, 2013, move in the SP 500 above the March, 2000 and October, 2007 SP 500 previous all-time-highs. My own expectation is to be cautious given the 93% total return in the SP 500 since January 1 ’19 (26% average, annual return w chart attached below). But to be clear “tapering” is not monetary tightening. The Fed is buying $120 billion in Treasuries per month, and per David Kelly of JP Morgan, that will likely be reduced by $12 – $15 billion per month until the end of 2022. Tapering just means there will be less liquidity being added each month until the Fed is buying nothing. Janet Yellen supported or commented positively on Jay Powell’s potential reappointment as Fed Chair which is scheduled for Q1 ’22 by President Biden, but she also may have given Jay Powell an opportunity to be less aggressive by noting that there are still 5 million people out of work today, then pre-pandemic.
Finally, there are a number of SP 500 earnings opinions emerging on 2022. This blog noted last weekend that 2022 is looking “average” so far. The comp against the 2nd quarter 2021 will be tough, but we won’t have to wait long since Q4 ’21 earnings start in about 8 – 10 weeks and with Q4 ’21 earnings companies – probably for the first time since the pandemic – will likely give a more confident look or “guidance” to 2022 than in 2021. 2022 should have far fewer issues than the last 24 months.
According to IBES data by Refinitiv, here is the “upside surprise” percentages for the last 5 quarters:
- Q3 ’21: EPS upside surprise 10.9%, revenue +2% (still in progress);
- Q2 ’21: EPS upside surprise +15.7%, revenue +5.2%;
- Q1 ’21: EPS upside surprise +21.3%, revenue +4%;
- Q4 ’20: EPS upside surprise +15.7%, revenue +3.7%;
- Q3 ’20: EPS upside surprise +19.6%, revenue +3.6%;
- Q2 ’20: EPS upside surprise +22.9%, revenue +2.7%;
- Q1 ’20: EPS upside surprise +2.6%, revenue -0.6%;
Thanks to Thomas Alonso of Refinitiv for giving me the numbers.
Here’s a little color just to conclude: I asked Tom for the data last week, prior to the Big 5 reporting, and – at that time – probably Monday or Tuesday – the EPS upside surprise was 13.9% and the revenue upside surprise was 2.9%, by the end of the week, probably Apple Amazon and Facebook missing – we saw a 3% drop in EPS and a 1% decline in revenue upside. (That should help give readers some scale.)
Summary / conclusion: Anyway, I thought readers would like to see the data too.
The EPS upside surprise will return to the 2% – 5% “normal” parameters historically (is my guess) in 2022 so don’t be swayed by articles trying to scare you away – the above surprise numbers will decline for sure. If they don’t there is likely a more upside to stocks.
Here’s the annual return for the SP 500 the last 3 years:
- 2019: +31%
- 2020: +18.34%
- 2021: 24% (YTD as of 10.31.21)
Chart: (source YCharts)
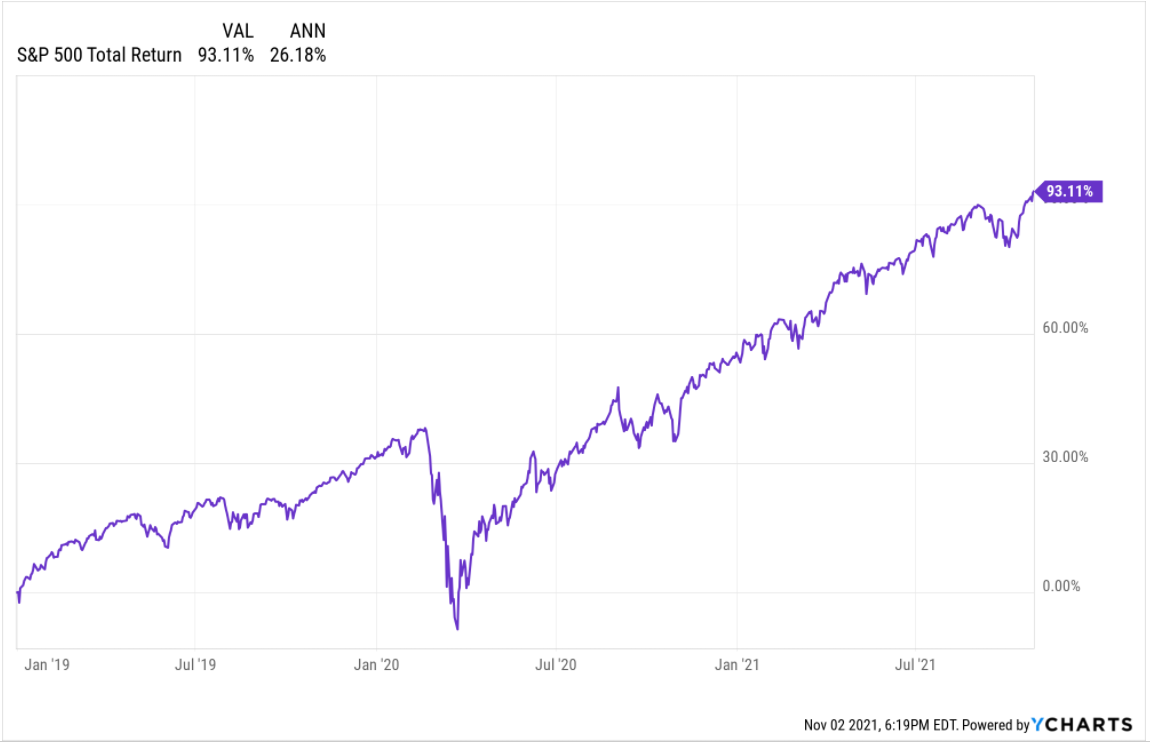
Have to be honest with readers, I thought the “val” should be closer to 73%, over the time frame, not 93%. Sometimes I wonder about Ycharts data, although I worry more that I am programming it properly.
That’s about it. Just some talking points tonight.
Thanks for reading.