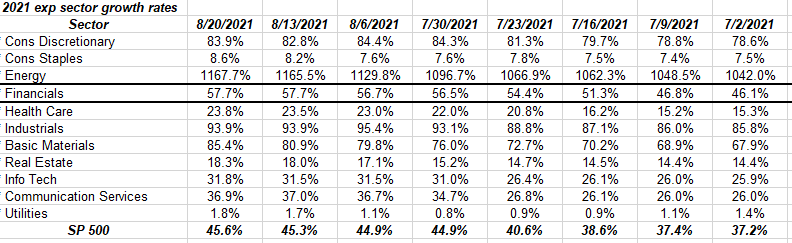
This table is from IBES data by Refinitiv’s weekly “This Week in Earnings”, just with a longer perspective.
Every single SP 500 sector’s expected 2021 growth rate is higher since July 2, 2021.
The SP 500 – as of today – is expected to see 45% EPS growth this year, and that could easily be up over 50% when Q4 ’21 earnings start rolling in.
2021 is turning out to be a remarkable year earnings wise.
Q3 ’21 and Q4 ’21:
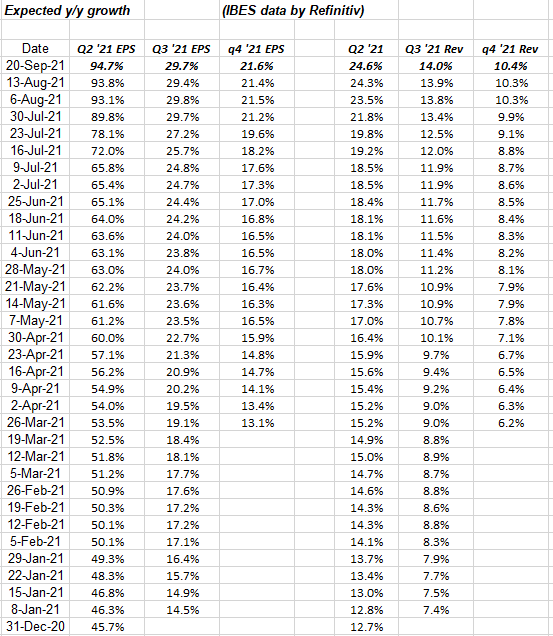
With Q2 ’21’s financial results almost entirely in the books now, attention is turning to Q3 and Q4 ’21 and the data in the above table continues to indicate higher expected growth rate week-after-week.
Sell-side analysts have grossly underestimated the revenue and EPS strength of the SP 500 since the pandemic started. Hence, analyzing the near-term earnings data should be the bread crumbs that direct us on the investing path.
Q3 and Q4 ’21 EPS and revenue revisions continue to portend positively.
Rate of change:
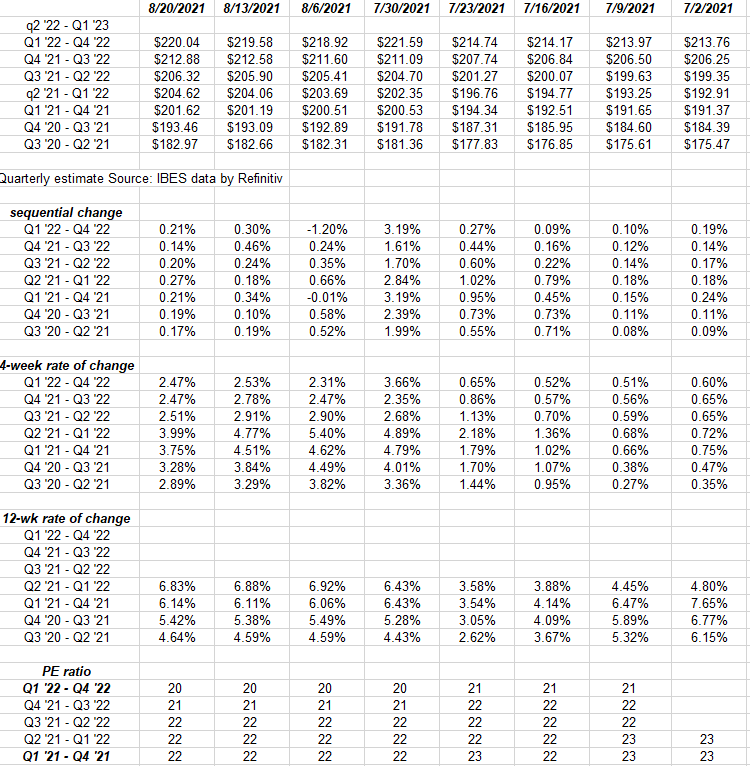
It’s a struggle to get the SP 500 forward EPS curve data on one page, but note the 12-week rate of change.
The week of July 30, 2021, was a big week for Tech sector earnings so let’s see if the 12-week rate of change can continue into September ’21.
Next week and the pre-Labor Day week will be pretty quiet.
SP 500 data:
- The forward 4-quarter estimate rose to $206.32 this week from $205.89 last week. No doubt Walmart’s earnings report helped.
- The PE ratio is now 21.5x
- The SP 500 “earnings yield” is back to 4.66%, bumping against it’s highest levels since last May ’20.
- The Q2 ’21 “bottom-up” estimate is $52.57 this week, versus $52.26 last week, up from $41.99 on April ‘1, ’21.
- The Q3 ’21 bottom-up EPS estimate today is $49.18 up from $45.63 last April ’21.
Summary / conclusion: The problem with tracking SP 500 EPS data is that recessions are not always your typical “business-cycle” recession, with the pandemic being a perfect example. The SP 500 EPS data wouldn’t predict a pandemic, but it did get in front of the Q4 ’18 correction in the SP 500 since the SP 500 data peaked the exact week the SP 500 peaked.
Tracking the above data using IBES data by Refinitiv, can get pretty boring but it gives readers (me) a feel for trends both in sectors and the overall SP 500.
Q3 and Q4 ’21 continue to see positive revisions just like Q3 and Q4 ’20 and every quarter since the Fed and Congressional stimulus. With the financial crack wear off ? Absolutely, but with Treasury yields low and corporate credit spreads so tight, “the song remains the same” as they say.
The positive revenue revisions look particularly encouraging for Q3 and Q4 ’21.
This could all change in an instant so take it all with a grain of salt.
Thanks for reading.