The first aspect of the weekly earnings data that jumped out this weekend is that it appears one or more strategists grew more bearish or pessimistic on the SP 500’s calendar-year estimates for 2021, 2022, and 2023 even though the “forward 4-quarter” estimate continued to improve.
Here’s how the data tracks:
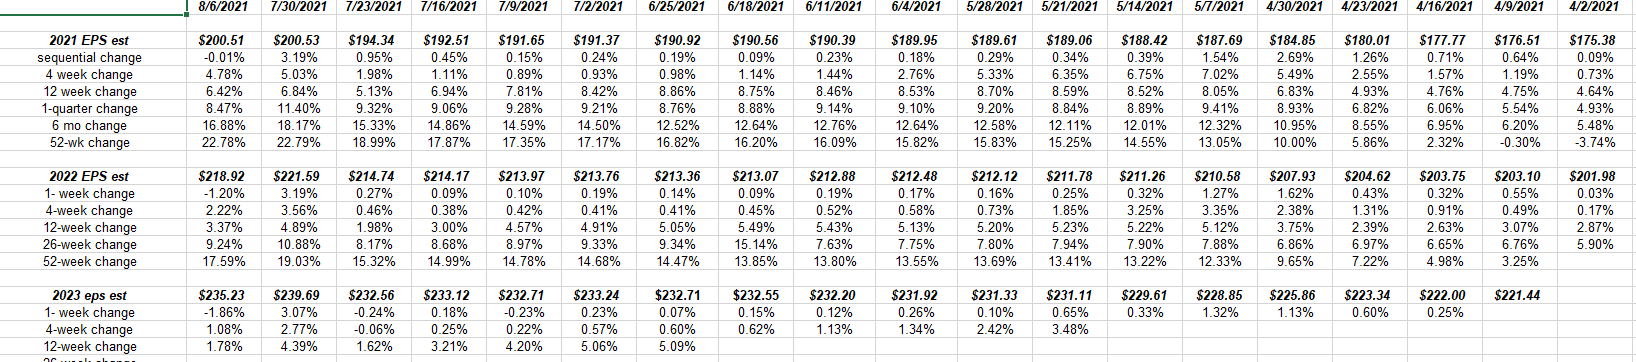
Readers can see the more recent 8/6/21 column’s sequential decline in SP 500 EPS estimates this week, meaning that the 2021, 2022 and 2023 SP 500 EPS estimates were revised lower.
Is it meaningful ? It could be. Right now it’s just one week. It certainly disrupts the overall higher revision trend seen over the last 15 – 16 months.
(The data will be verified at Refinitiv.)
Looking at the SP 500’s other metrics:
- The forward 4-quarter SP 500 EPS estimate rose this past week to $205.41 vs last week’s $204.70;
- The PE ratio on the forward estimate is 21.6x vs 21.5x last week
- The PE ratio was 23.9x as of early April ’21 so the SP 500 has actually seen some PE compression as Q2 ’21 actual earnings and revenue have come in much stronger-than-expected;
- On April 2, ’21 the Q2 ’21 SP 500 EPS was expected to grow 50% y/y. instead it has risen 93%, while the Q2 ’21 SP 500 revenue growth was expected to be 15.2% on April 2, ’21 instead it has grown 23.5%;
- The SP 500 earnings yield was 4.63% as of Friday, August 6th, versus 4.66% the week before.
- The bottom-up estimate for Q2 ’21 increased again to $51.91 or almost a $1 a share from last week’s $50.96. It’s probably not a stretch to estimate already that Q3 ’21’s current bottom-up estimate of $49.27 is too low and it will be comfortably above $50 by the end of October ’21.
Here’s the revision in expected growth rates for the next 6 quarters for the SP 500:
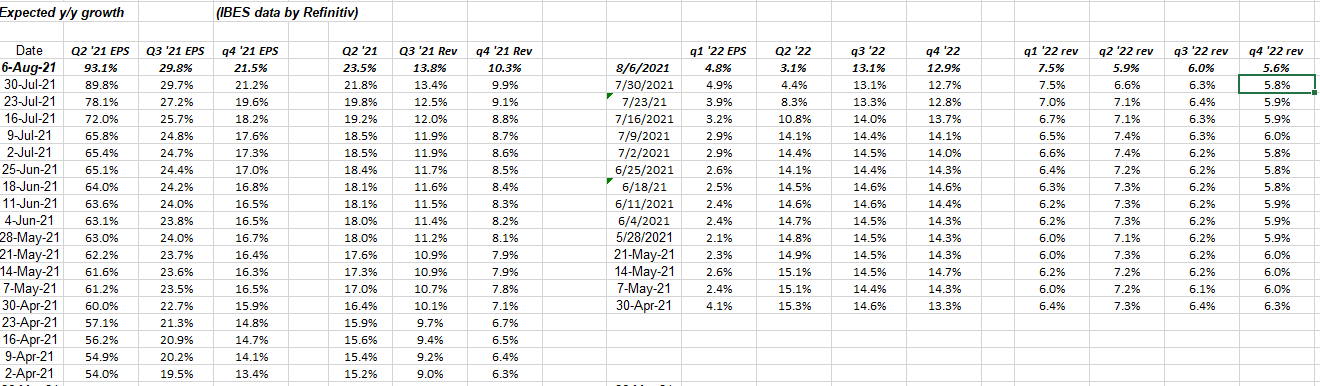
Note the trends in SP 500 EPS and revenue growth for Q3 and Q4 ’21.
If the sell-side’s overall pessimism continues and the actual results beat the estimates to the degree that has been happening since Q2 ’20, then that bodes well for Q3 and Q4 ’21.
However, note the 2022 revisions in the 8 columns to the right on the above spreadsheet.
It’s still a little early get a fix on 2022, given how the sell-side estimated 2021, but 2022 will continue to be brought to the attention of readers just to keep it top of mind.
The stock market is a discounting mechanism, so there could be a case made for the SP 500 discounting today what SP 500 earnings and revenue growth will look like in mid-2022.
Actual SP 500 earnings in dollars:
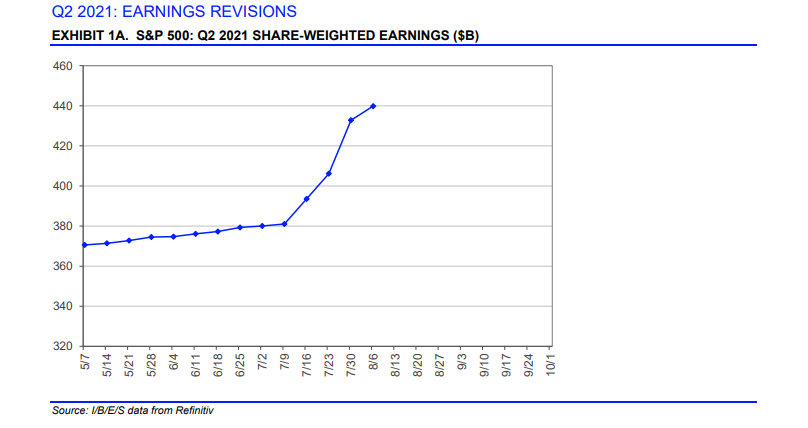
This graph is from page 1 of the IBES data by Refinitiv “This Week in Earnings” (TWIE) report published weekly by Refinitiv. This report is the source of most of the data you see on this blog, just repackaged for analyzing longer-term trends. This chart is from the TWIE report dated August 6, ’21.
Although Refinitiv labels this graph “share-weighted earnings” in fact what I suspect this chart tracks is overall earnings or “net income” for the SP 500 since if it was “share-weighted” it would be the bottom-up estimate for the SP 500 for Q2 ’21.
The graph is an attempt to show the actual dollar growth in net income for the SP 500 for Q2 ’21 which is approximately the difference in the $440 billion today or as of August 6th, 2021, vs the $360 billion estimate around the start of July ’21, or $60 billion.
Because percentages are used so much in SP 500 earnings data, looking at the change in actual net income gives readers a different perspective on growth.
Summary / conclusion: While it may seem to be a minor distinction for readers – if you look at the first spreadsheet at the top of this weekends blog – there is a difference between the calendar-year estimate for the SP 500 and what are called quarterly bottom-up estimates for each quarter of the calendar year. When John Butters was the Refinitiv or Thomson Reuters principal in charge of earnings aggregation and reporting, he explained to me that the “top-down” or full-year estimate is compiled from strategist and analyst estimates, while the bottom-up number is from sell-side analyst models.
The point of this discussion being that top-down estimates can be fewer estimates calculated with less “rigor” and can be unduly influenced by one excessively bullish or bearish strategist estimate.
As I’ve understood it over the years, the bottom-up or quarterly estimates are more analytically-rigorous and can be less prone to ball-parking and such.
That may not be the case this week, so it bears mentioning to readers that the lower revisions for the calendar-year SP 500 EPS estimates are worth noting.
The point for readers is that the estimates are updated weekly, so we’ll see if the data are signifying a change in trend.
Per “This Week in Earnings” 443 of the SP 500 companies have already reported their Q2 ’21 financial results. We’ll start to see July quarter end with Walmart (WMT) and Cisco (CSCO), who report in the next few weeks
Coinbase (COIN) reports Tuesday, August 10th, after the closing bell. Clients have a small – almost immaterial – position in the stock. COIN has elements of a disruptor and is a traditional way for clients to get some exposure to crypto risk, in a traditional investing vehicle. COIN’s earnings preview can be found on www.seekingalpha.com probably late afternoon on Monday or early Tuesday, August 10, 2021.