With the vast majority of the SP 500 having reported their Q1 ’21 financial results, the estimate revision activity will likely slow now until mid-July ’21, wne the 2nd quarter starts to get reported.
Fast fact: the SP 500 has traded +/- 22x forward earnings since January 6, 21. The forward estimate is up $31 per share since 12/31/20, from $159.02 to this week’s $191.52, and the market multiple has varied less than 5% for that entire period.
Here’s a quick rundown on the data:
- The forward 4-quarter estimate rose this past week to $191.52 from last week’s $190.94 and the aforementioned 12/31/20 print of $159.02. Having updated this data weekly for some 15 – 20 years (a nod to my good friend Jeff Miller, may he rest in peace), the pattern since the Fed liquidity went DEFCON 1 last year has been nothing short of incredible. The pattern for SP 500 earnings and their revisions is typically nothing like this. It deserves a longer article.
- The PE on the new forward estimate is 22.09x;
- The SP 500 earnings yield is 4.53% versus last week’s 4.54% and the 12/31/20 print of 4.23%;
- As promised last week, the Q2 ’21 quarterly bottom-up estimate for the SP 500 this week is 44.49, versus last week’s $44.37. The compare versus Q2 ’20 final quarterly bottom-up print was $27.98. The growth rates are going to look stratospheric, but that will be the peak for 2021.
Let’s look at the SP 500 earnings tables:
First a quick look to see SP 500 EPS and revenue revisions for 2022:
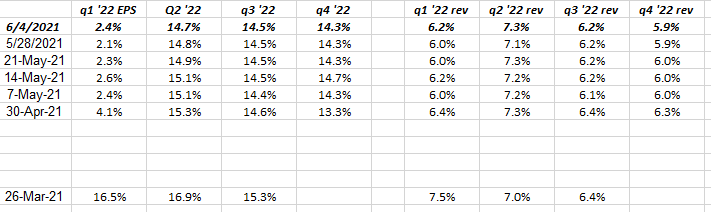
Data source: IBES data by Refinitiv
Readers can see (click on spreadsheet to enlarge) that while 2022 quarterly EPS and revenue estimates declines sharply from the initial March ’21 expectations, they have started to stabilize the last 5 weeks.
2022 will likely see “normal” earnings and revenue revisions as we lap the post-COVID world.
2021 quarterly SP 500 EPS and revenue revisions:
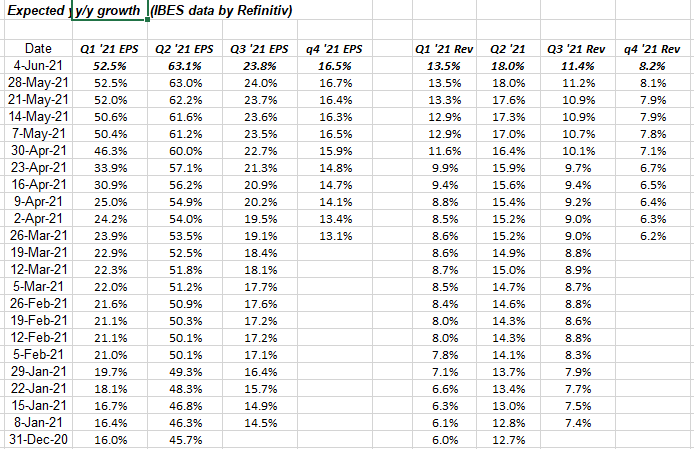
Data source: IBES data by Refinitiv
I love this table for readers since – at one perusal – readers can see the upward revisions that the SP 500 is seeing for EPS and revenue for calendar 2021.
The catch is – as was written in this post in early May ’21– once the Q2 ’21 earnings in July, August ’21, are lapped, the compares start to get tougher and the y/y growth rates will likely start to slow.
Liz Ann Sonders, the Schwab Strategist wrote something similar this week. She has some great charts in her write-up, but it’s a longer read. These blog posts usually are kept short and sweet so you don’t feel like you’re reading “War & Peace”.
One final chart:
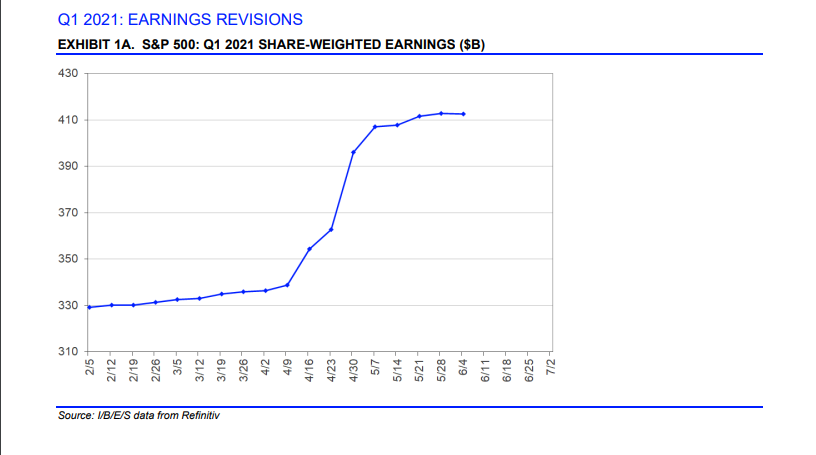
Source: “This Week in Earnings”
One aspect of SP 500 earnings data that I’ve always wondered about is the actual revenue dollars, operating income, and net income that the SP 500 generates every quarter and year. No doubt Goldman and the other white shoe brokerage houses possess this model, but I’ve never seen it published.
The above graph has graced the front page of Refinitiv’s “This Week in Earnings” for two decades and yet only in recent years have I begun taking a closer look at the graph.
Note how on 4/2, the SP 500 consensus was expecting roughly $330 – $340 bl in net income, but since then the quarterly net income has risen over $410 billion, meaning just since the start of Q1 ’21 earnings season, the SP 500 has generated approximately $75 billion in net income “surprise”.
I’ve asked IBES by Refinitiv if they would share their dollar information and history with me, and the answer was they don’t have that information or history, which is somewhat puzzling since somewhere the “net income” dollars are being tracked.
If you are ever talking to an individual investor and you want to see them become puzzled, start talking “earnings per share” (EPS) with individual stock valuation or investing.
The basic formula for “EPS” is net income / fully diluted shares outstanding = earnings per share.
Talking to a client in the late 1990’s about a stock they held in an account – a former employer of theirs – I nonchalantly said about the recent stock movement, “Yes, they beat earnings by $0.04 per share and the stock took off” and she became very agitated with me and said, “Why do I care about pennies ?”
Summary / conclusion: As we love into earnings season in July ’21 all investors will start to lap the easiest quarter of last year in terms of y/y growth rates, when the SP 500, for the 2nd quarter of 2020, saw revenue decline 8.7% and SP 500 EPS decline 30%.
- q1 ’20: SP 500 EPS fell 12.8% y/y, revenue fell -1.3%
- q2 ’20: SP 500 EPS fell -30.6%, revenue fell -8.7%
- q3 ’20: SP 500 EPS fell -6.5%, revenue fell -0.1%
Looking at the 2nd table above, Q2 ’21 EPS growth is expected at 63.1% while SP 500 revenue growth is expected at 18%. (Think about that.)
The point of all this is that the rally in cyclicals and inflation worries and trying to extrapolate investing themes for 2022 is more complicated than usual thanks to roller-coaster ride we’ve been on the last 15 months.
Be sure and take everything you read with substantial skepticism, and a healthy grain of salt. Invest based on your own financial profile and your appetite for volatility.
Thanks for reading.