It’s easy to go off on a tangent when analyzing SP 500 earnings data so here is a quick summary of this blog’s conclusions:
1.) Look at various periods (i.e. annual and quarterly estimates) over various time frames, i.e. this current quarter, the next quarter and the next calendar year ahead.
2.) Look at averages in the forward numbers as was suggested a few weeks ago here.
Here is a good example of what is meant:

Averaging the current expected fall of 13% with 2021’s expected rebound of 23%, results in an “average” SP 500 EPS growth rate for the next 20 months of +5%.
I’m interested in how this changes in the next 3 weeks, through the unofficial end of earnings season on May 15th, 2020.
If readers would have been asked what the “average” expected growth rate for SP 500 earnings is expected to be over the next two calendar years, would you have answered 5% ?
If i were to include 2019’s 1% SP 500 EPS growth (actual growth) with 2022’s expected 12%, the four year average is 6%, inline with the post WW II average of 7% over the last 80 years.
3.) Don’t forget revenue growth as this blog wrote about yesterday, Saturday, April 18th, 2020 here.
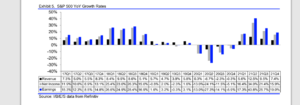
This IBES by Refinitiv graph from yesterday’s post shows the progression of SP 500 revenue growth since Q1 ’17.
The “average” of SP 500 revenue growth since Q1 ’17 and not including Q1 ’20’s expected flat growth, is 6.5%, with a high of 9.5% in Q2 ’18 and a low of 3.6% in Q2 ’19.
As it stands right now, SP 500 revenue growth won’t return to “average” growth until early 2021, if then.
Remember these are still just projections that will change, possibly materially, by mid-May ’20.
4.) The “forward earnings curve” matters:
- Cal ’21 SP 500 EPS est: $173.74
- Q4 ’20 – Q3 ’21 fwd est: $166.11
- Q3 ’20 – Q2 ’21 fwd est: $157.32
- Q2 ’20 – Q1 ’21 fwd est: $145.70
- Cal ’20 SP 500 EPS est: $141.00
The above SP 500 estimates are what the consensus bottom-up SP 500 estimates by quarter are expecting (per IBES) as of 4/17/20, but the catch is each of these numbers will change over the next week, month and three months.
What to look for in following these numbers even as the near-term numbers will be volatile (i.e the calendar 2020 and forward 4-quarter estimate today of $145.70), is stability in the calendar 2021 estimates and the q4 ’20 – Q3 ’21 forward estimate. Showing a slowing rate of deceleration will give investors a signal on “true earnings” that the SP 500 will find eventually.
5.) The “rate of change” matters
Summary / conclusion: Each week, as this blog is written I feel like I can head off on tangents that don’t necessarily lead the reader (or myself) to any firm conclusions. Today was an attempt to clear up what is likely some confusion on the part of readers as well as clarify my own thinking on forward earnings at a time where the financial media commentary ranges from sheer hysteria to – well – nothing of help at all.
Because the Q3 ’20 – Q2 ’21 forward estimate of $157.32 is still less than 2019’s actual SP 500 EPS of $162 and change, what i’m most interested in watching is the Q4 ’20 – Q3 ’21 and full-year calendar ’21 estimates to start to NOT be revised lower or to start to slow their deceleration so that investors can get some comfort that the “blended 2020 – 2021 SP 500 EPS growth rate might actually be mid-single digits.
The other thing that complicates this is that the Presidential election is likely to have a YUGE (sic) impact on tax and business policies and 2021, as well as Congressional election results.
Hope this helps readers as much as it helped me write this out.
Believe nothing and take all market forecasts with substantial skepticism.
Thanks for reading.